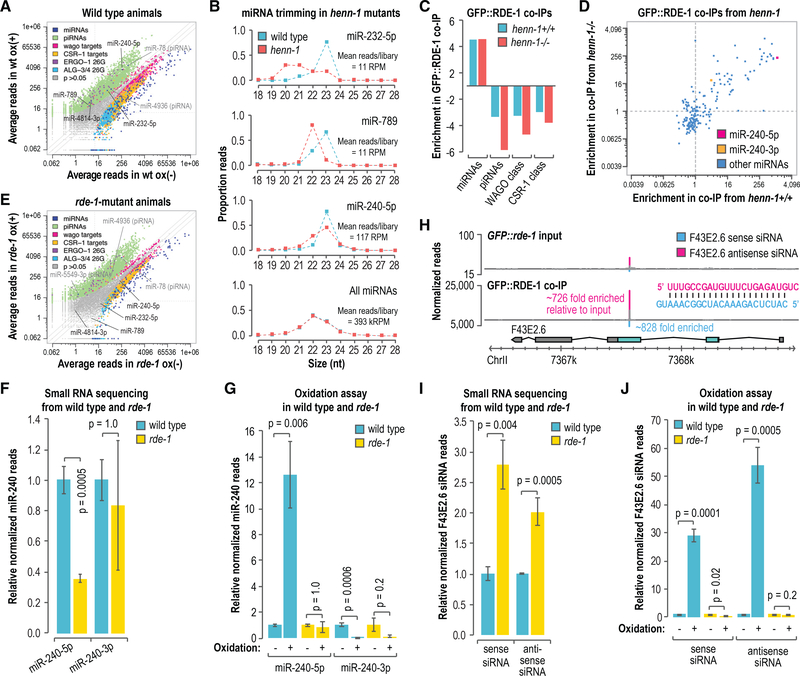
Figure 5. Accumulation of Modified miRNAs and Primary siRNAs Is Dependent on rde-1.
(A) Scatterplot displaying each small RNA feature (miRNA, piRNA, WAGO-class 22G-RNA locus, CSR-1-class 22G-RNA locus, ALG-3/4-class 26G-RNA locus, and ERGO-1-class 26G-RNA locus) as the average number of normalized reads in control (x axis, ox–) and oxidized small RNA libraries (y axis, ox+) (n = 3 biological replicates). Data are from wild-type L4-stage animals.
(B) The proportions of total reads for each miRNA in L4 larvae are plotted by size. The “all miRNAs” plot corresponds to the combined proportions of reads for all annotated miRNAs. The data do not contain biological replicates.
(C) Enrichment or depletion of the indicated classes of small RNAs in GFP::FLAG::RDE-1 coIPs relative to cell lysates. Data are shown for 1 of 2 biological replicates.
(D) Scatterplot displaying each miRNA as its enrichment in GFP::FLAG::RDE-1 coIPs relative to cell lysates from adult animals wild type (henn-1+/+) (x axis) or mutant for henn-1 (henn-1(pk2295)) (y axis). Dashed lines are at 1-fold enrichment on each axis.
(E) Scatterplot displaying each small RNA feature, as in (A), as the average number of normalized reads in control (x axis, ox–) and oxidized small libraries (y axis, ox+) (n = 3 biological replicates). Data are from rde-1(ne219) L4-stage animals grown in parallel to the wild-type animals used in (A).
(F) miR-240–5p and miR-240–3p reads in rde-1(ne219) relative to wild type (n = 3 biological replicates). Error bars report standard deviation.
(G) miR-240–5p and miR-240–3p reads in wild type and rde-1(ne219) from small RNA libraries treated with sodium periodate (oxidation +) relative to libraries receiving a control treatment (oxidation –) (n = 3 biological replicates). Error bars report standard deviation.
(H) Read distribution across the F43E2.6 siRNA-generating locus from GFP::FLAG::rde-1 cell lysate (input, top plot) and GFP::FLAG::RDE-1 coIP small RNA libraries (bottom plot). The most abundant siRNA duplex produced from the locus is shown. Enrichment in the GFP::FLAG::RDE-1 coIP relative to the input is shown for each siRNA.
(I) F43E2.6 sense and antisense siRNA reads in rde-1(ne219) relative to wild type (n = 3 biological replicates). Error bars report standard deviation.
(J) F43E2.6 sense and antisense siRNA reads in wild type and rde-1(ne219) from small RNA libraries treated with sodium periodate (oxidation +) relative to libraries receiving a control treatment (oxidation –) (n = 3 biological replicates). Error bars report standard deviation.
See also Figure S5.

