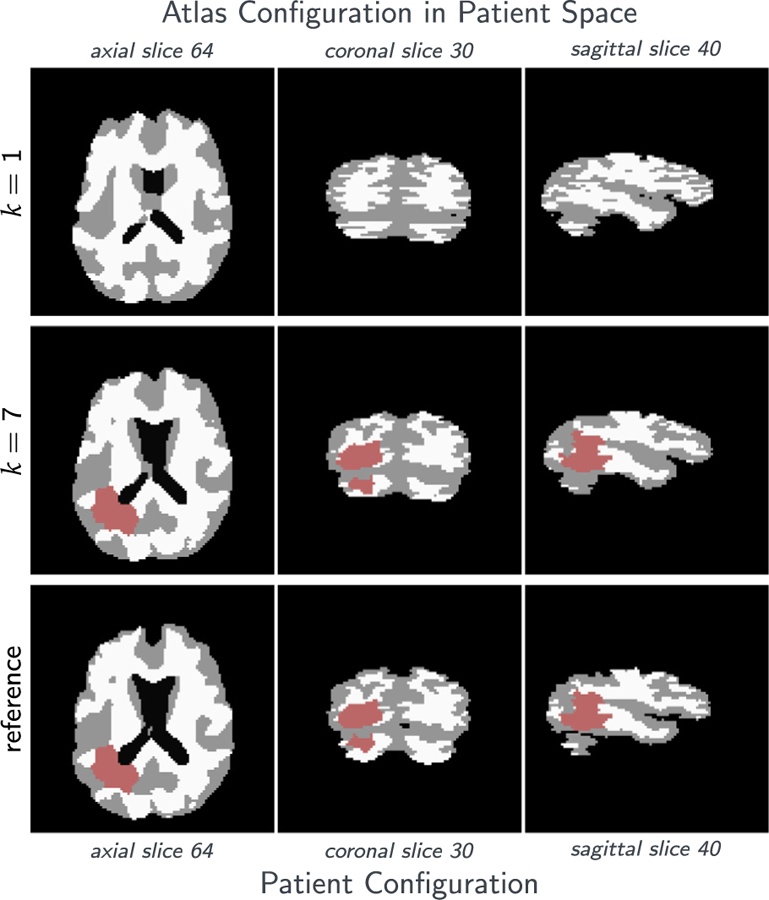
Fig. A.10.

Tumor and brain labels (obtained by thresholding probability maps) for the analytic tumor with analytic velocity with non-zero diffusion (ATAV-DIF) test case; ground truth: (ρ f = 10, ρw = 1, ρg = 0, k f = 1.00E−2, kw = 1, kg = 0, p = p⋆, v = −v⋆). We show results for the inversion (velocity and initial condition) if we use the true (“correct”) tumor parameters used to generate the test case (i.e., ρ f = 10 and k f = 1.00E−2). The top row shows the initial label maps for the atlas image. The middle row shows the label maps for the atlas image after registration (transported to the patient space) and the bottom row shows the label maps for the patient data. We can see that the results are qualitatively in excellent agreement. This is confirmed by the values for the mismatch and Dice coefficients for the labels and probability maps for the individual tissue classes reported in Table 5.
