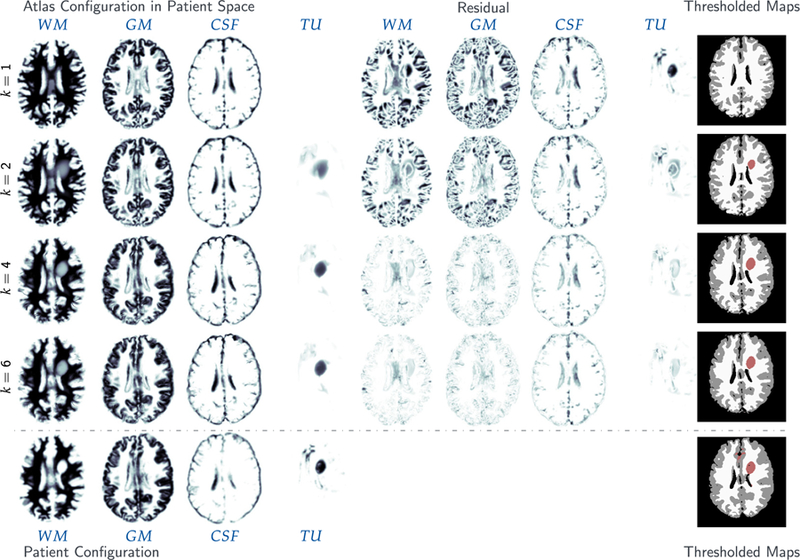
Fig. A.17.

Results for the real tumor/ real velocity (RTRV) test case, ground truth (ρ N/A, k N/A, p N/A, v N/A) and the AAWI patient. The figure shows probability maps for the labels of the healthy atlas brain (k = 1; top row) and the AAAN patient (target) brain probability maps with tumor (bottom row), along with the reconstructed probability maps throughout the Picard iterations (k = 2, 4, 6) (axial-slice 132).
