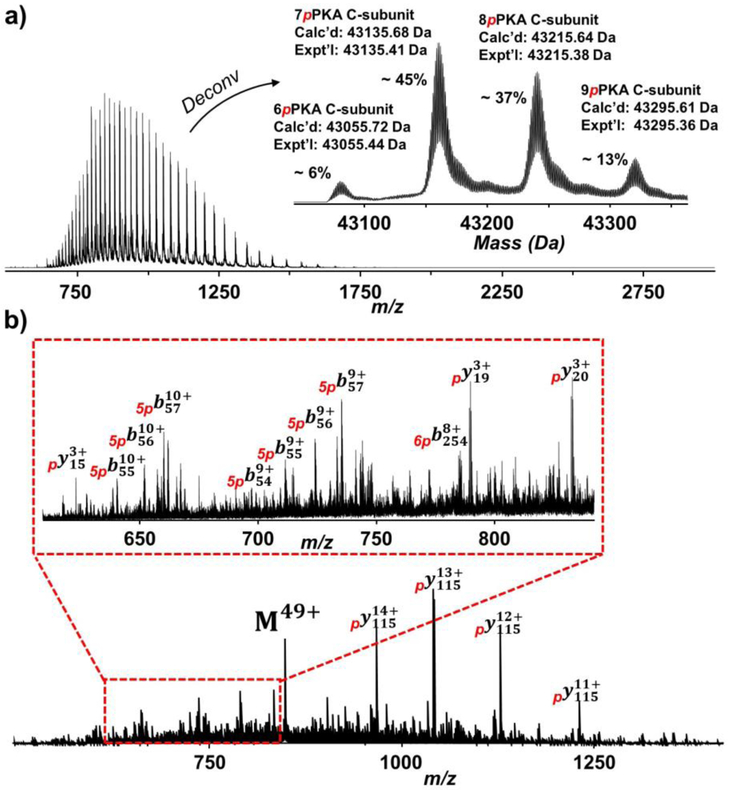
Figure 2.
Top-down MS analysis of the PKA C-subunit. a) Mass spectra with charge state distribution and deconvoluted (inset) spectra of the PKA C-subunit. The most abundant proteoform purified from E. coli expression contained seven phosphorylations with removal of N-terminal methionine. b) The precursor at charge state 49+ was subjected to online LC-MS/MS with CID fragmentation. 560 – 850 m/z is zoomed in to show a variety of b and y fragment ions (inset).

