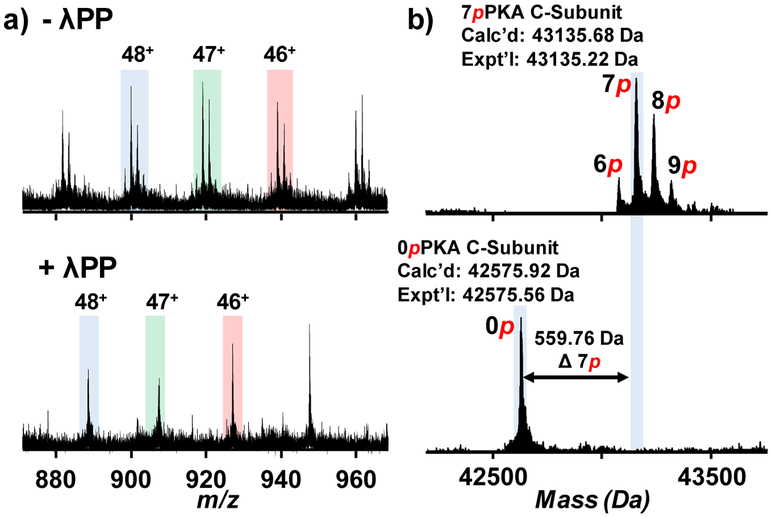
Figure 6.
Analysis of the dephosphorylation of the PKA C-subunit using Lambda protein phosphatase (λPP). a) Charge states 48+, 47+, and 46+ were shown for PKA C-subunit before (top) and after (bottom) the dephosphorylation reaction. b) Deconvoluted spectra were shown for the analysis of the dephosphorylation reaction. All phosphorylations were removed, resulting in a single unphosphorylated proteoform in the spectra.

