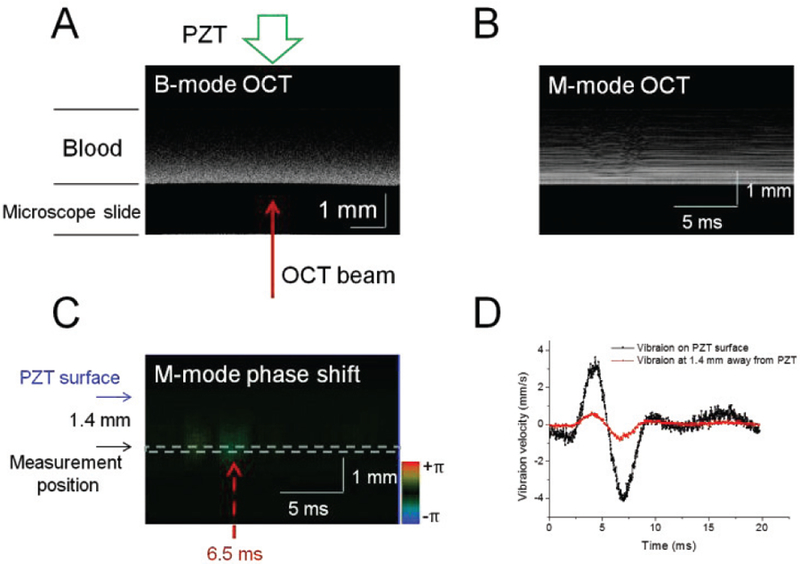
Fig. 2.

Vibration measurements in the blood sample. (A) OCT image in B-mode at 1 min after kaolin addition with a final concentration of 0.75 g/L. One M-scan OCT image (B) and the corresponding Doppler phase image (C) captured at 1 min following recalcification. The time interval Δt is 0.10 ms. (D) Vibration velocities on the PZT surface and 1.4 mm away from the PZT surface.
