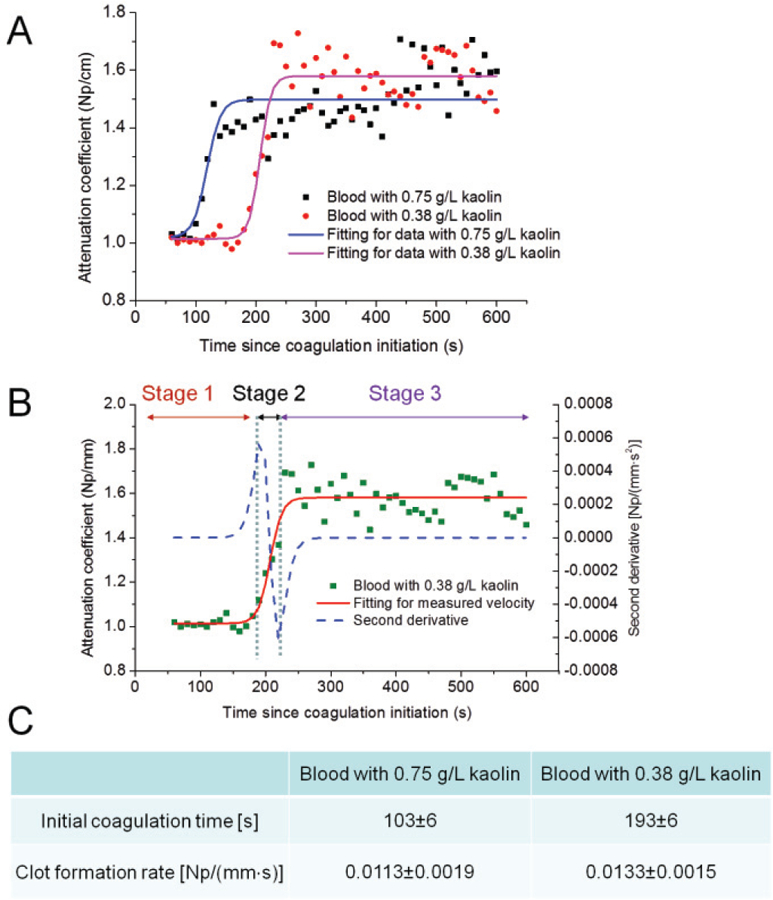
Fig. 3.

Monitoring of attenuation coefficients during blood coagulation in samples with different concentrations of kaolin solution. (A) Tracings of attenuation coefficients: three distinct stages are fitted into an S-curve. (B) Change of attenuation coefficients divided into three stages in the sample with a kaolin concentration of 0.38 g/L. (c) Coagulation metrics including the initial coagulation time and the clot formation rate: three samples for each group were tested.
