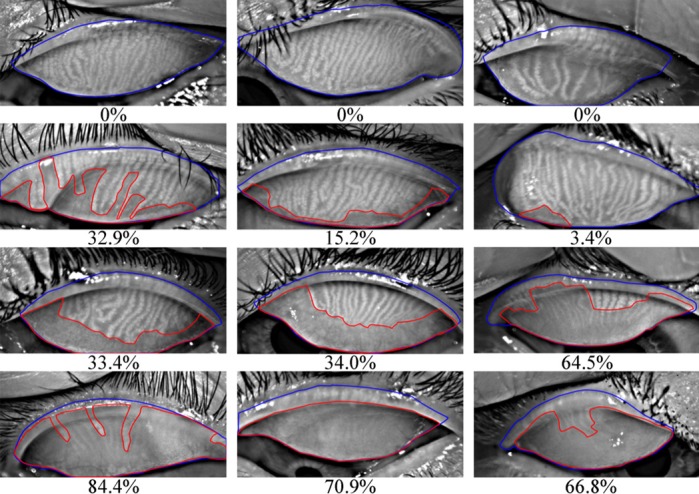
Figure 1.

Meibography images with ground-truth percent atrophies (%) and ground-truth meiboscores. Rows 1 to 4 refer to images with meiboscores of grade 0 to 3, respectively. Given a meibography image, the area of gland atrophy (marked in red) and eyelid (marked in blue) are compared by our deep learning algorithm to estimate the percent atrophy  (Equation 1), and are further converted to meiboscore according to the criteria in Table 1.
