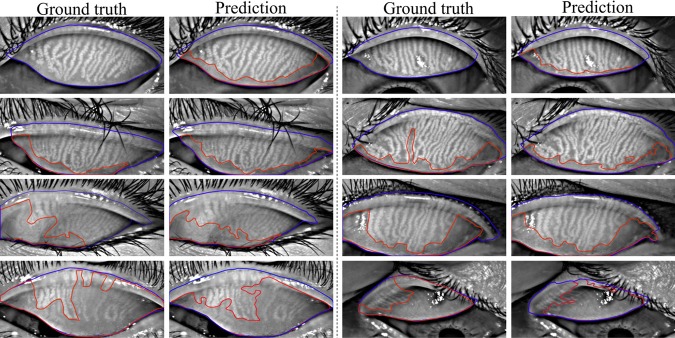
Figure 7.
Eyelid (outlined in blue) and atrophy (outlined in red) segmentations from the deep learning algorithm versus the ground-truth. Rows 1 to 4 refer to meiboscores of grade 0 to 3, respectively. The first and third columns are ground-truth images from the annotators, while the second and fourth columns are algorithm predictions. The algorithm predictions shared high visual similarity with the ground-truth, especially for eyelid region segmentation.

