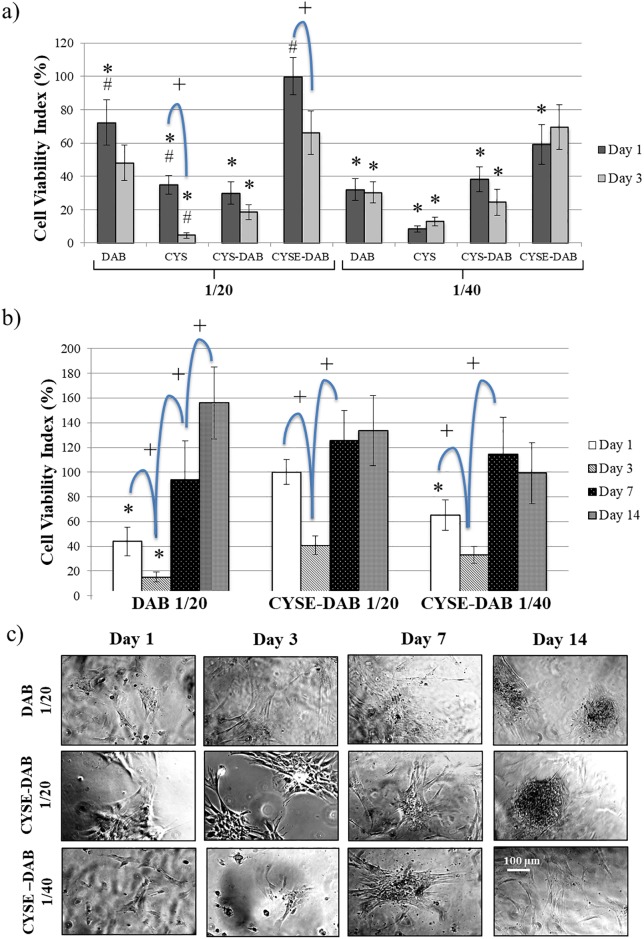
Fig 2. Cell viability on different PASP hydrogels on day 1 and 3 (a), long term viability on PASP-DAB1/20, CYSE-DAB1/20 and CYSE-DAB1/40 gels (b) and phase-contrast microscopic images of PDLCs in long term experiments at different time points (c).
The viability value measured on CYSE-DAB1/20 gels on day 1 was considered 100%. Data are given as an arithmetic means ± SEM (standard error of the mean). *p < 0.05 compared to CYSE-DAB1/20 at the appropriate time point. +p < 0.05 compared to the next day. Each photomicrograph was taken at the same magnification.

