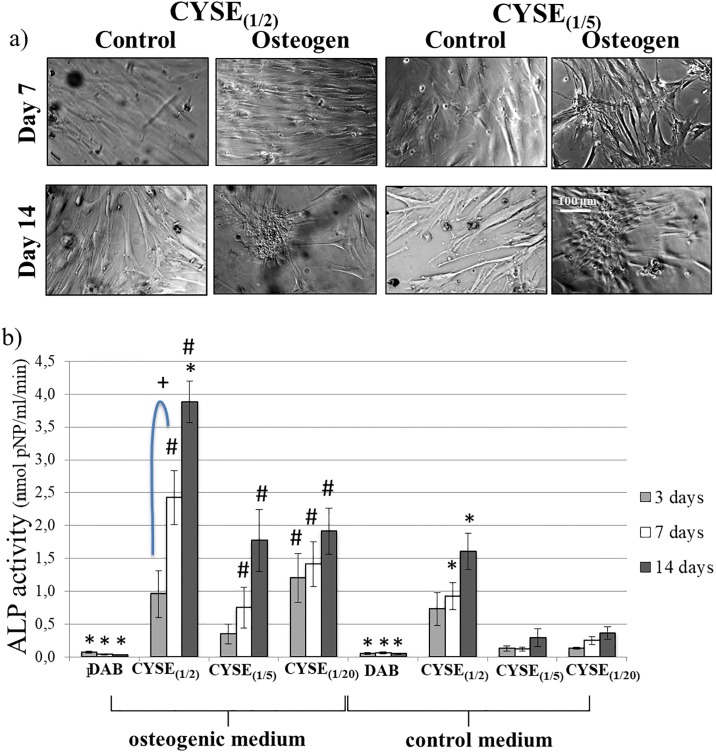
Fig 5.
a) Phase-contrast microscopic pictures of osteogenic inducted and control PDL cells on PASP hydrogel disks containing different quantity of thiol groups. b) ALP activity of PDL cells cultured in osteogenic or control medium on PASP hydrogel disks after 3, 7 and 14 days. Each photomicrograph was taken at the same magnification. The scale bar indicates 100 μmData are given as an arithmetic mean ± SEM (standard error of the mean). *p < 0.05 compared to CYSE(1/20) at the appropriate time point. +p < 0.05 compared to next day values. #p < 0.05 compared to the appropriate control gel values.

