Figure 5.

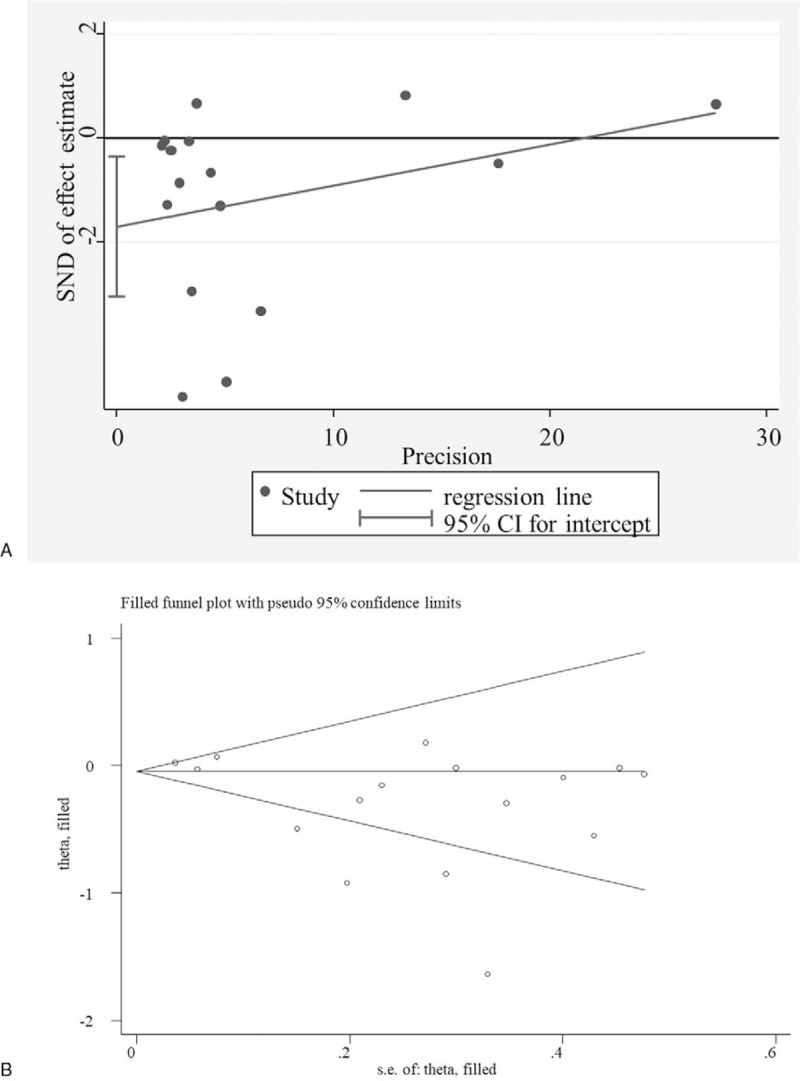
Potential publication bias. A, Egger funnel plot for the assessment of rs1800795 polymorphism (GG+GC vs CC); Trim and fill for adjusting publication bias. CI = confidence intervals, SND = standard normal deviation.

Potential publication bias. A, Egger funnel plot for the assessment of rs1800795 polymorphism (GG+GC vs CC); Trim and fill for adjusting publication bias. CI = confidence intervals, SND = standard normal deviation.