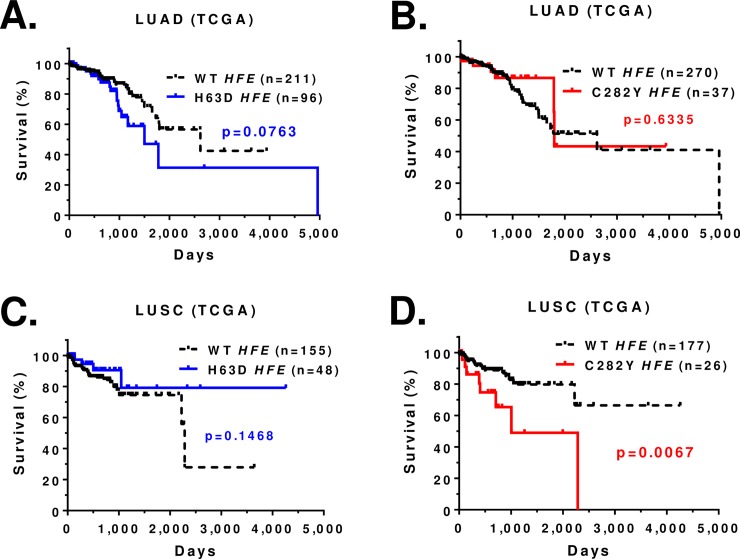
Fig 3. Kaplan-Meier survival curve for TCGA lung cancer patients (Caucasians) with HFE genotype.
(A) Survival curve of LUAD patients with WT or H63D HFE. (B) Survival curve of LUAD patients with WT or C282Y HFE. (C) Survival curve of LUSC patients with WT or H63D HFE. (D) Survival curve of LUSC patients with WT or C282Y HFE. Statistical analysis was performed by log-rank test and indicated as p value. Censored record is indicated as + in the graph.

