Figure 2.

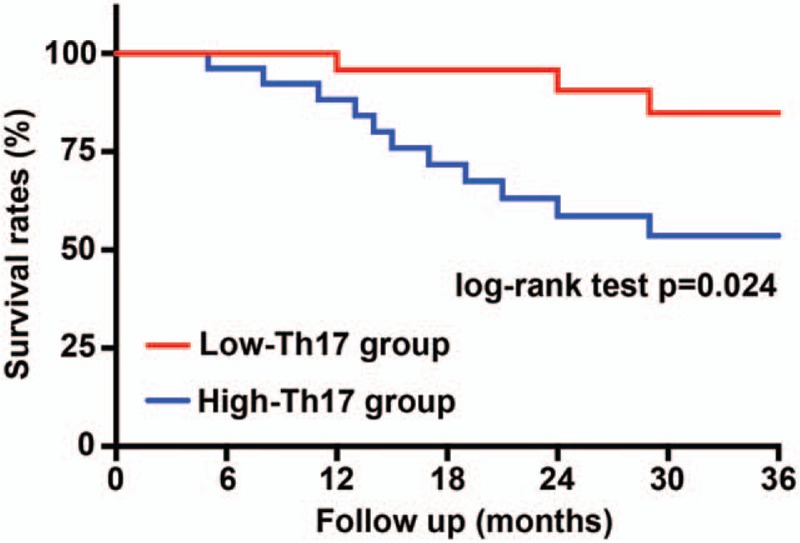
Kaplan–Meier curve of survival rates based on low and high circulating levels of Th17 cells. N = 70 for each group. The P-values are from the log-rank test.

Kaplan–Meier curve of survival rates based on low and high circulating levels of Th17 cells. N = 70 for each group. The P-values are from the log-rank test.