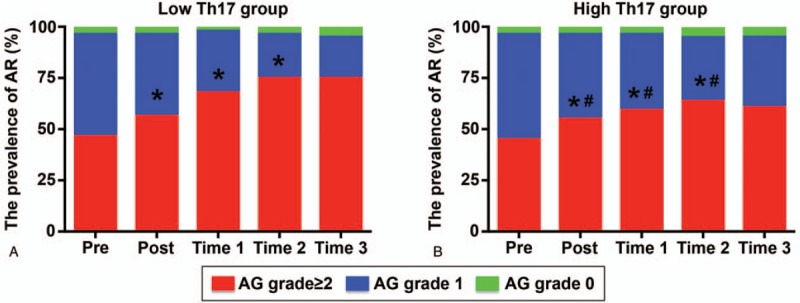
Figure 4.

Aortic reflux in each group. (A) Aortic reflux in the low-Th17 group preoperatively (pre), postoperatively (post), and at T1, T2, and T3; (B) aortic reflux in the high-Th17 group measured at different time points. ∗P < .05 versus previous time points; #P < .05 versus low Th17 group.
