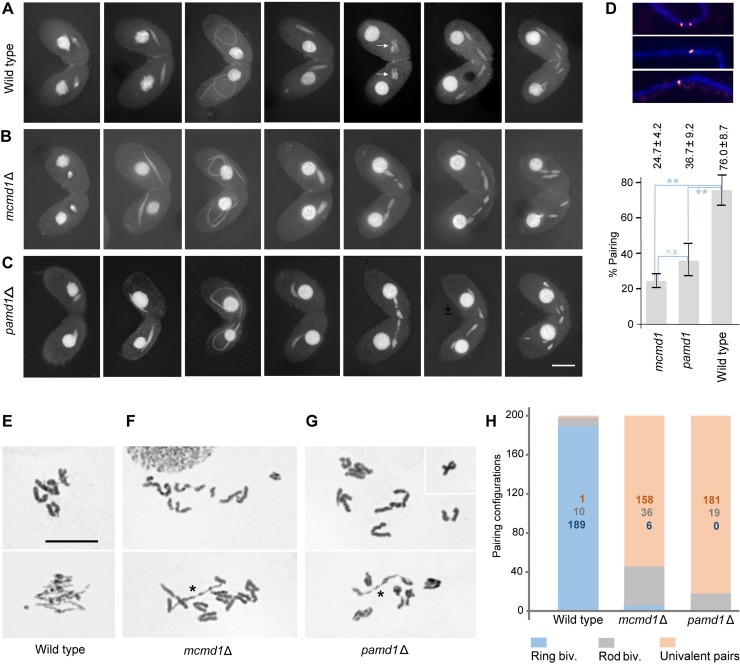
Fig 2. Meiotic stages and chromosome configurations in wild-type and mutant cells.
(A‒C) Meiotic progression in (A) wild-type, (B) mcmd1Δ, and (C) pamd1Δ cells. Arrows in (A): Metaphase plate. (D) Pairing of homologous loci marked by FISH, with examples of single signals and two joined signals (scored as paired), and two separate signals (scored as unpaired). Error bars represent the SD from three counts of 50 nuclei each. Paring was significantly reduced in mcmd1Δ (t-test: p-value = 0.003248) and pamd1Δ (t-test: p-value = 0.005888) cells compared to wild-type cells, and did not differ significantly (n.s.) between the two mutants (t-test: p-value = 0.1398). (E‒H) Diakinesis‒metaphase I configurations (Giemsa staining). (E) Diakinesis (top) and metaphase (bottom) in the wild type with five bivalents. At diakinesis centromeres are stretched out with thin tips due to the start of microtubule attachment. Bivalent arms on both sides of the centromeres are in close contact, suggesting the presence of chiasmata in both arms. During metaphase, bivalents are arranged in a metaphase plate. Most of them are ring-shaped, indicating chiasma formation in both arms. (F) Examples of the mcmd1Δ diakinesis‒metaphase stages. Chromosomes mainly form univalents. (G) Examples of the pamd1Δ diakinesis‒metaphase stages with univalents. Univalents never assemble into a metaphase plate and become prematurely oriented toward the poles in a random fashion. The asterisks denote rod bivalents. Bars: 10 μm. (H) Quantification of bivalent (biv.) and univalent configurations. A total of 200 chromosome pairs were evaluated for each genotype.

