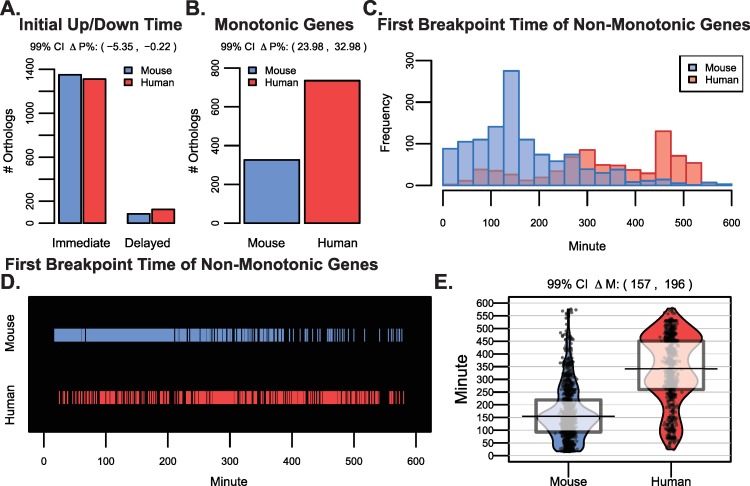
Fig 2. Initial human and mouse ortholog expression trends begin at similar times yet last for longer in human.
A) The number of genes having an up or down trend occurring immediately versus those displaying a delayed trend is shown. The two mouse/human bars represent genes having either immediate or delayed dynamics. The 99% confidence interval for the difference in the percent (ΔP%) of orthologs having an immediate up/down trend was -5.35% to -0.22%. B) The number of orthologs that had monotonic expression patterns (i.e. no breakpoints) along the time courses. The 99% confidence interval for the difference in the percent (ΔP%) of monotonic orthologs in human versus mouse was 23.98% to 32.98%. C) For non-monotonic genes (i.e. those having at least one breakpoint), histograms of the first breakpoint time are shown for mouse and human genes. D) Similar to C), the time of the first breakpoint is highlighted in either blue or red for mouse and human orthologs. E) The first breakpoint times for mouse and human orthologs are represented as smoothed densities (bean plots) with overlaid raw data, the median, and a box representing the interquartile range. The 99% confidence interval on the paired Wilcoxon rank sum statistic for shift in distribution (ΔM) was 157 to 196 minutes.

