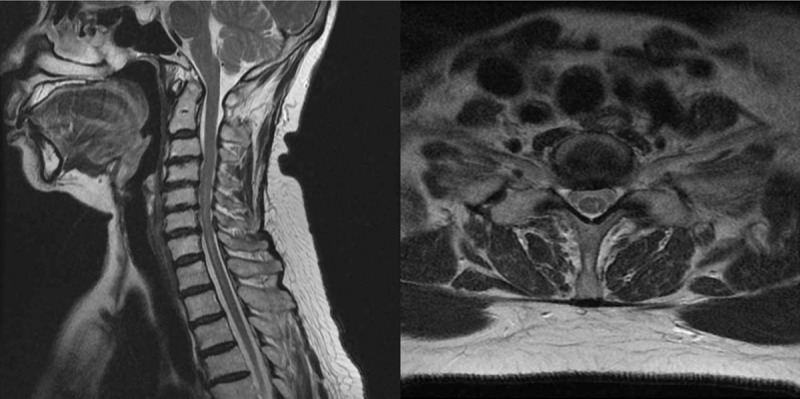
Figure 3.

(A) Sagittal T2-weighted image of the cervical spine, the interval much decreased in the axial extent of the intramedullary high signal intensity at the left side spinal cord from C4 to T3, with decreased edema. (B) axial T2-weighted image of the cervical spine, showing decreased in the axial extent of the intramedullary high signal intensity.
