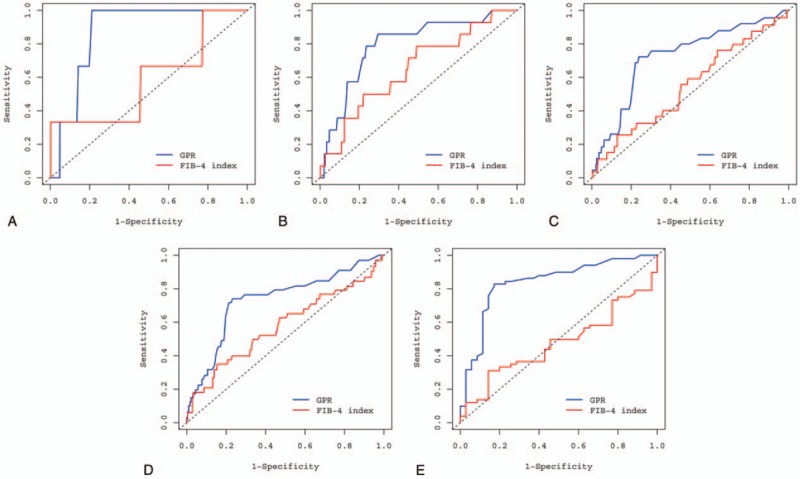
Figure 3.

Time-dependent ROC curves for GPR and the FIB-4 index to predict hepatocellular carcinoma development. (A) Receiver-operating characteristic (ROC) curve for GPR and the FIB-4 index at the 1-year time point, (B) ROC curve for GPR and the FIB-4 index at the 3-year time point, (C) ROC curve for GPR and the FIB-4 index at the 5-year time point, (D) ROC curve for GPR and the FIB-4 index at 7-year time point, (E) ROC curve for GPR and the FIB-4 index at 10-year time point. FIB-4 = fibrosis-4, GPR = gamma-glutamyl transpeptidase-to-platelet ratio.
