
Figure 4.
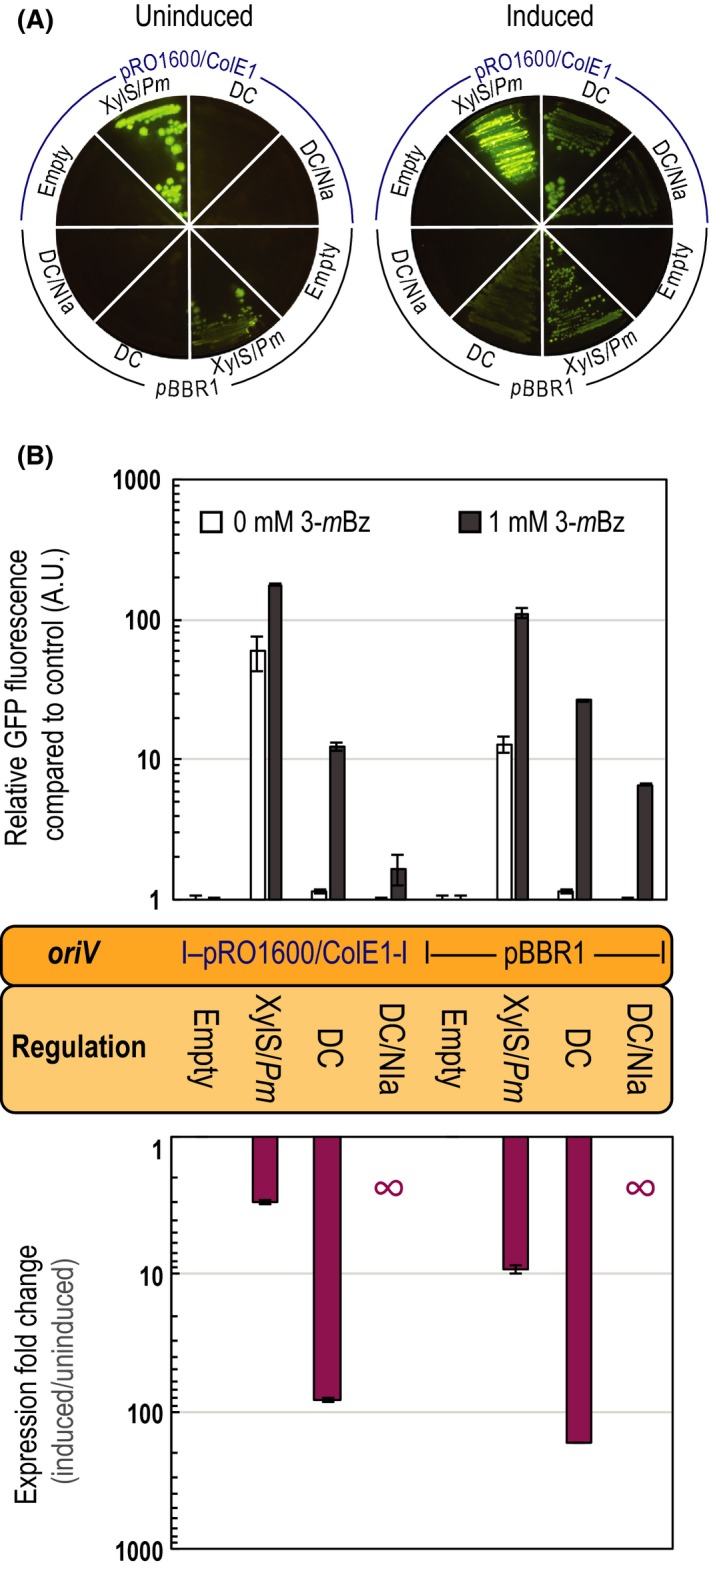
Characterization of the tightly regulated expression systems for Pseudomonas based on physically decoupled XylS/Pm elements and conditional proteolysis.A. M9 minimal medium plates with 0.2% (w/v) citrate, containing 0 mM (left) or 1 mM (right) 3‐methylbenzoate (3‐mBz) were seeded with P. putida with an empty Tn7 module integrated into the chromosome and transformed with either vector pSEVA231 or vector pSEVA241, which served as negative controls (indicated as Empty in the figure). The same strain was transformed either with plasmid pS238·GFP or pS248·GFP carrying the XylS/Pm expression system in its original configuration (indicated as XylS/Pm in the figure). Strain KT·P, containing a chromosomal copy of xylS, was transformed either with plasmid pS23·Pm‐GFP or pS24·Pm‐GFP, in which the xylS/Pm system has been physically decoupled (indicated as DC in the figure). Strain KT·PN, containing a single xylS/Pm→nia integration in the chromosome, was transformed either with plasmid pS23·Pm‐GFP* or pS24·Pm‐GFP* harbouring the decoupled xylS/Pm system and equipped with conditional proteolytic control of GFP due to inducible nia expression (indicated as DC/NIa in the figure). Strains harbouring plasmids pS24x (x represents any of the variants described above) carrying the origin of vegetative replication (oriV) pRO1600/ColE1 were seeded in the upper part of the plate, while strains harbouring the plasmids pS23x, carrying oriV(pBBR1), were seeded in the lower part. Plates were incubated at 30°C for 18 h. The plates were visualized under blue light (Safe‐Imager, Invitrogen) and photographed.B. The increase in msfGFP fluorescence per unit of biomass (estimated as the optical density at 600 nm) relative to the negative control was measured during cultivation in M9 minimal medium containing 0.2% (w/v) citrate supplemented or not with 3‐mBz at 1 mM (upper part) and the resulting expression fold changes (lower part). Depicted in the diagram are the genetic elements either integrated into the single Tn7 integration site in the chromosome or plasmid‐borne. Bars represent the mean values of the corresponding parameter ± standard deviation (n ≥ 3 in all cases), and a Student t‐test revealed significant differences between all groups. Note that in some cases the level of msfGFP fluorescence of control experiments was below the limit of detection; in these experiments (DC/NIa), the ratio between induced and uninduced conditions is indicated with a ∞ symbol.