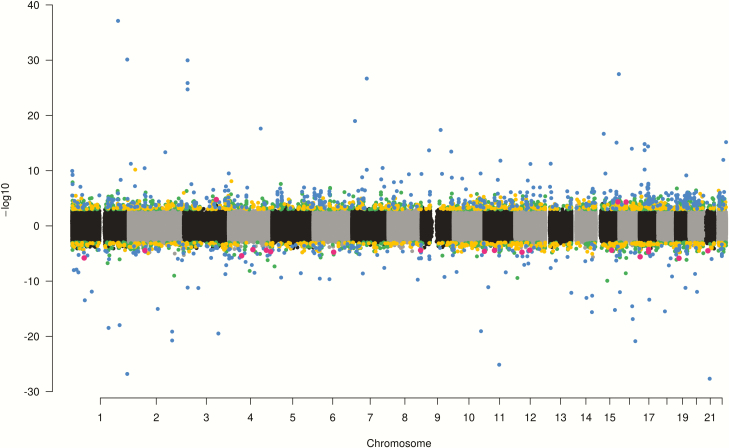
Figure 5.
Manhattan plot of results of analyses for differential methylation by sex at birth. CpG sites that were hypermethylated in boys compared to girls are plotted above the y-axis, while hypomethylated sites are below the y-axis. 5mC + 5mC sites are highlighted in green, 5mC sites are yellow, 5hmC sites are red and sites associated with two or more methylation measures are blue.

