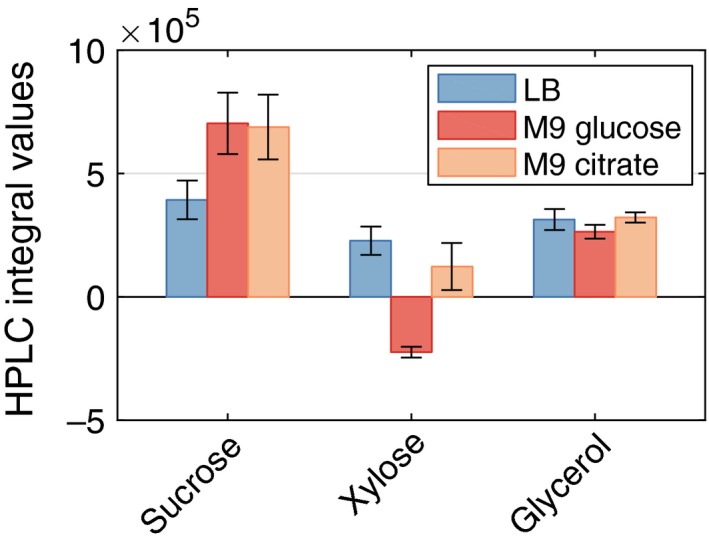
Figure 4.

Permeability of the outer membrane of P. putida EM178 estimated from the swelling experiment using a hypertonic solution of 0.15 M sucrose, xylose and glycerol in M9 medium. The bars represent the estimated substrate amounts (as quantified by their peak areas in HPLC) after washing the cells with deionized water, normalized with the fluorescence signal of GFP in supernatants according to Eqs (1) and (2). They should therefore represent the amount of substrate that is able to permeate through the outer membrane. Mean values and standard deviations are derived from three replicates. From left to right: blue bars: precultures grown in LB; red bars: precultures grown in M9 glucose; orange bars: precultures grown in M9 citrate.
