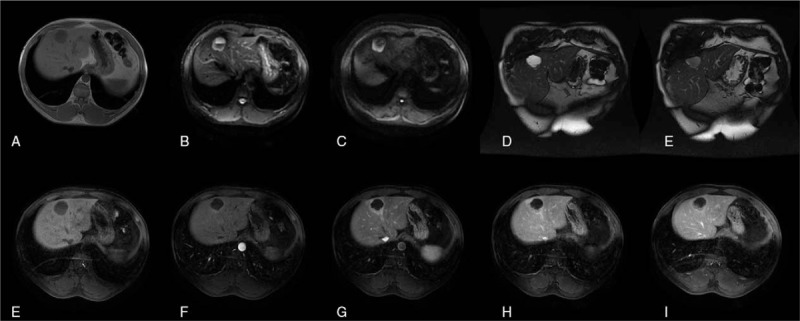
Figure 2.

MRI results of 26 months after initial hospitalization showed that the diameter of the lesion increased from 40 mm to 60 mm. (A) Hybrid low signal on T1WI. (B) The axial T2WI lipid image showed mixed high signal. (C) DWI. (D) Coronal T2WI weighted images. (E) Coronal T2WI weighted images. (F) Enhanced anterior mask. (G) Early enhancement of arteries. (H) Late enhancement of arteries. (I) Enhanced venous phase. (J) Enhanced delayed phase.
