Figure 2. Binding characterization of amantadine to ABP.
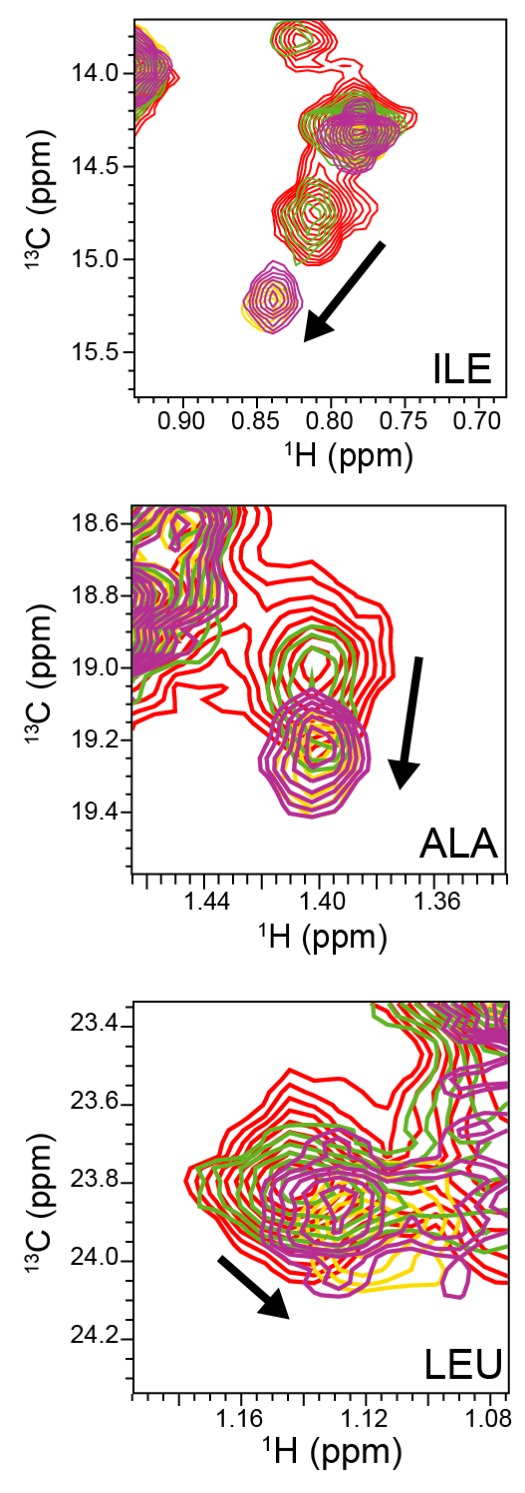
(a) SEC chromatogram monitoring absorbance at 280 nm (mAU) and estimated molecular mass (from MALS). (b) Apo-ABP (orange, open circle) exhibits a high initial fluorescence signal that is lowered in the presence of amantadine (orange, solid circle). As expected, 2LC3H6_13 (blue, open triangle) and 2LC3H6_13 plus amantadine (blue, solid triangle) exhibit a very low initial fluorescence signal and overlap almost identically. (c) The CD spectrum of ABP at 25°C, 75°C, 95°C, and 25°C after heating and cooling. The CD spectrum of ABP at 25°C suggests an all ɑ-helical structure that remains fairly stable up to 75°C. (d) 2D amide 1H-15N HMQC spectra (left) and 2D methyl 1H-13C HMQC spectra (right) of 250 μM apo-ABP (red) or ABP in the presence of 2 mM amantadine (blue) recorded at 800 MHz, 37°C. Titration of amantadine leads to significant changes in the ABP NMR spectra (arrows). To the right of the 2D methyl methyl 1H-13C HMQC spectra an inset of dissociation constant estimate through conventional fraction bound analysis is shown for the affected ILE methyl group, with an estimated KD of <55 μM. (e) NMR line shape fitting of ABP throughout the NMR titration with amantadine performed in the program TITAN using a two-state binding model for the affected ILE methyl group. The NMR data (gray) are shown versus the TITAN fit (magenta).

Figure 2—figure supplement 1. CD spectrum of ABP in the presence amantadine.
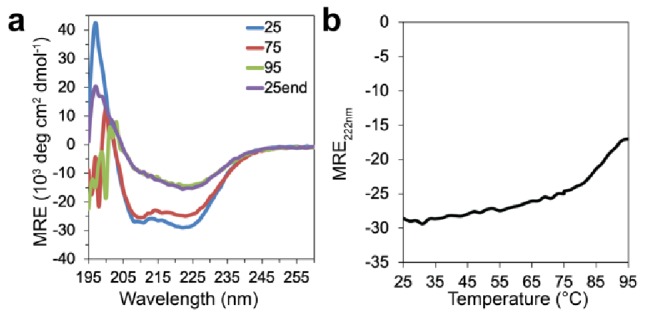
Figure 2—figure supplement 2. NMR titration of ABP with amantadine.