. 2019 Nov 26;8:e48646. doi: 10.7554/eLife.48646

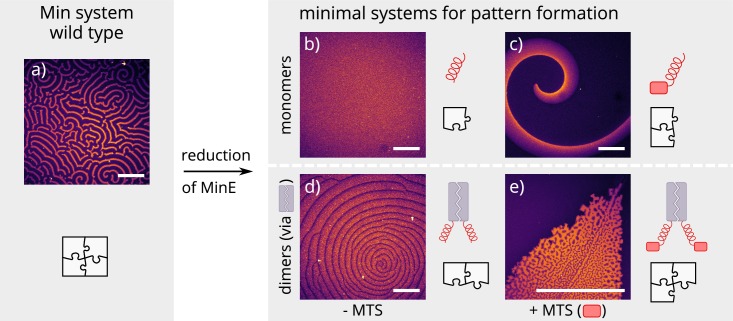
Figure 2. Patterns formed by the wild-type Min system and our minimal biochemical interaction networks.

(a) MinD and MinE self-organize to form evenly spaced travelling waves when reconstituted on flat lipid bilayers. (b) The minimal MinE peptide capable of ATPase stimulation is MinE(13-31); it does not facilitate pattern formation. (c) The fragments MinE(1-31) and MinE(2-31)-sfGFP contain the membrane-targeting sequence (MTS) in addition to the ATPase stimulation domain. Substituting MinE with these constructs leads to pattern formation; see Figure 2—video 13. (d) Fusing the ATPase stimulation domain MinE(13-31) with dimerization domains (we tested Fos, Jun, or GCN-4) facilitates pattern formation in the absence of the MTS. (e) Combining membrane targeting and dimerization in a single construct produces quasi-stationary patterns. (Concentrations and proteins used: (a) 1 μM MinD, 6 μM MinE-His; (b) 1.2 μM MinD, 50 nM MinE(13-31); (c) 1.2 μM MinD, 50 nM MinE(1-31); scalebars = 300 μM; (d) 1 μM MinD, 100 nM MinE(13-31)-Fos; (e) 1.2 μM MinD, 100 nM MinE(1-31)-GCN4. In all assays, MinD is 70 % doped with 30 % Alexa647-KCK-MinD).

Figure 2.

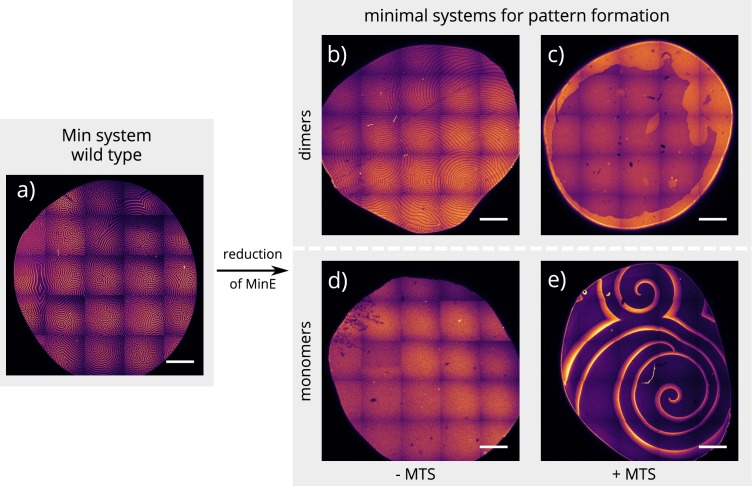
Figure 2—figure supplement 1. Global view of pattern formation by minimal systems.

Figure 2—figure supplement 1.

Overview images of the same experiment chambers as in Figure 2. (Concentrations and proteins used same as in main figure; scalebars = 1000 μm).

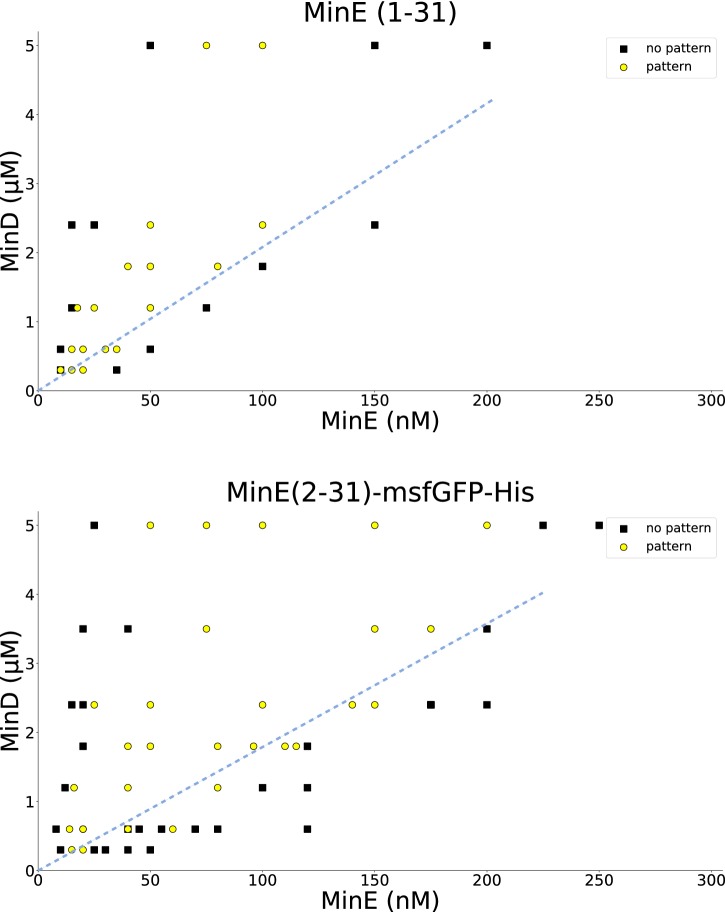
Figure 2—figure supplement 2. Titration results for MinE(1-31) and MinE(2-31)-sfGFP.

Figure 2—figure supplement 2.

MinD and the peptide MinE(1-31) or MinE(2-31)-sfGFP, respectively, were titrated to find the range in which patterns are formed. All experiments were done on SLBs consisting of DOPC:DOPG (2:1). Similar titrations for full-length MinE can be found in Glock et al. (2018a). Wild-type MinE generally forms patterns with MinD in a much larger range, going beyond 10 μM. Dashed blue lines were added by hand and highlight that there is a critical MinE-to-MinD concentration-ratio above which no patterns occur, in qualitative agreement with the theoretical results shown in Figure 3—figure supplement 2. A quantitative fit of the model to the threshold ratio of approximately 1/20 is shown in Figure 3—figure supplement 3.

Figure 2—video 1. MinE(1-31) forms chaotic patterns with MinD.

Download video file (7MB, mp4)
Timelapse of a stitched tilescan to visualize the entire assay chamber (5 μM MinD and 100 nM MinE(1-31) form patterns on an SLB formed from DOPC:DOPG (2:1)). 

Figure 2—video 2. MinE(2-31)-msfGFP forms chaotic patterns with MinD (1.8 μM MinD and 50 nM MinE(2-31)-msfGFP-His on 2:1 DOPC:DOPG).

Download video file (8.9MB, mp4)

Figure 2—video 3. Patterns with vastly different length and timescales coexist and continually transition into one another at certain concentrations of MinD and MinE(2-31)-msfGFP (0.6 μM MinD and 75 nM MinE(2-31)-msfGFP-His on 2:1 DOPC:DOPG).

Download video file (14.3MB, mp4)