
FIG. 1.
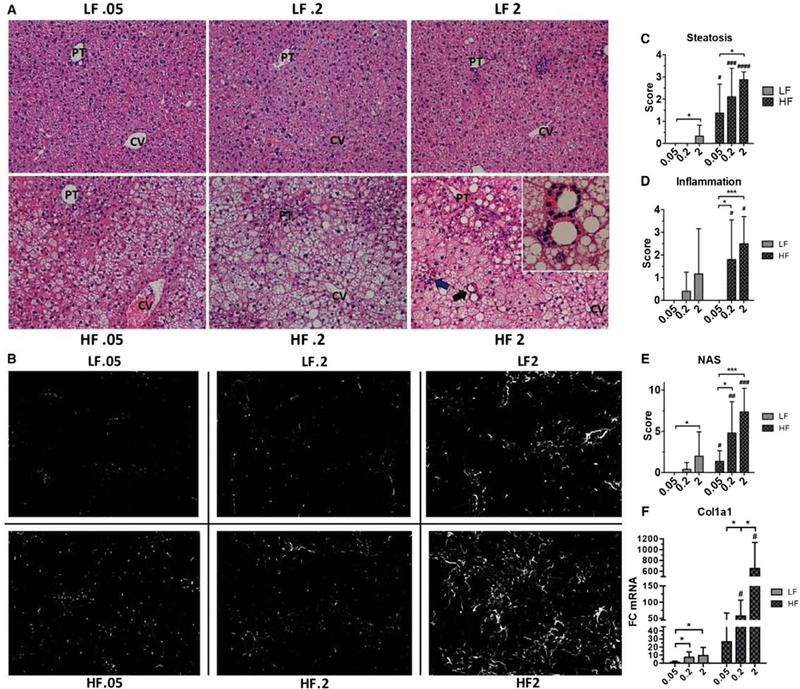
Dietary cholesterol induces a dose-dependent exacerbation of steatohepatitis and liver fibrosis. (A) Representative liver sections (×20) of each dietary group after 12 weeks of feeding. Lobular inflammatory foci (blue arrow) and lipogranulomas (black arrow, inset) were present only in HF.2 and HF2 livers and were most abundant in HF2 livers (see Supporting Table S3). (B) Representative sections of 12-week livers stained with anti-Col-1 antibody. In HF2 livers fibrosis developed in a pericellular pattern and predominated in zone 3 (see Supporting Fig. S4). (C) Semiquantitative scoring of steatosis for each dietary group. (D) Semiquantitative scoring of inflammation for each dietary group. (E) The NAS for each dietary group (see Supporting Table S3). (F) Whole-liver expression of procollagen 1 alpha 1. Rn18s was used as a reference gene for analysis. Bars represent the average ± standard deviation of each dietary group: 8–12 livers per group for semiquantitative pathology scoring (A,C-E) and 4–7 mice per group for real-time quantitative PCR analysis. Statistical significance was determined using Welch’s t test (C-E) and the Mann-Whitney U test (F). *P < 0.05, ***P < 0.001, #P < 0.05, ###P < 0.001 compared to corresponding low-fat diet. Abbreviations: Col1a1, procollagen 1 alpha 1; CV, central vein; PT, portal tract.