
FIG. 5.
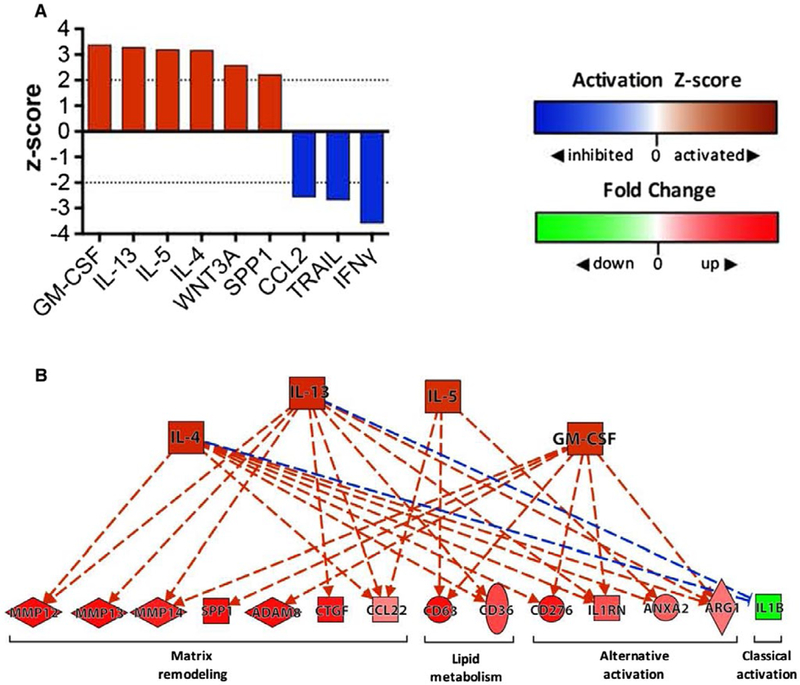
Upstream analysis ofHF2 KCs suggests signaling by type 2 cytokines. (A) Bar chart depicting the top “activated” and “inhibited” upstream cytokine regulators identified by IPA (Qiagen) when HF2 and LF.05 KC data sets were compared. An activation z score ≥2 indicates that the regulator is activated, while a z score ≤−2 indicates that the regulator is inhibited. IPA predicted that only six upstream cytokine regulators were activated (GM-CSF, IL-13, IL-5, IL-4, WNT3A, SPP1) and only 3 were inhibited (IFNγ, TRAIL, CCL2) in HF2 KCs. (B) A pathway diagram (produced with IPA) showing the upstream regulators (orange nodes) that are predicted to control expression of many of the key matrix remodeling genes, lipid metabolism genes, and phenotype markers (red/green nodes) identified by RNA-sequencing gene expression analysis (see Fig. 4) (solid line = direct interaction, dashed line = indirect interaction; orange line = leads to activation; blue line = leads to inhibition). Abbreviations: ADAM8, ADAM metallopeptidase domain 8; ANXA2, annexin A2; ARG1, arginase-1; Ctgf, connective tissue growth factor; GM-CSF, granulocyte-macrophage colony-stimulating factor; Il1rn, IL-1 receptor antagonist; TRAIL, TNF-related apoptosis-inducing ligand; WNT3A, Wnt family member 3A.