
FIG. 7.
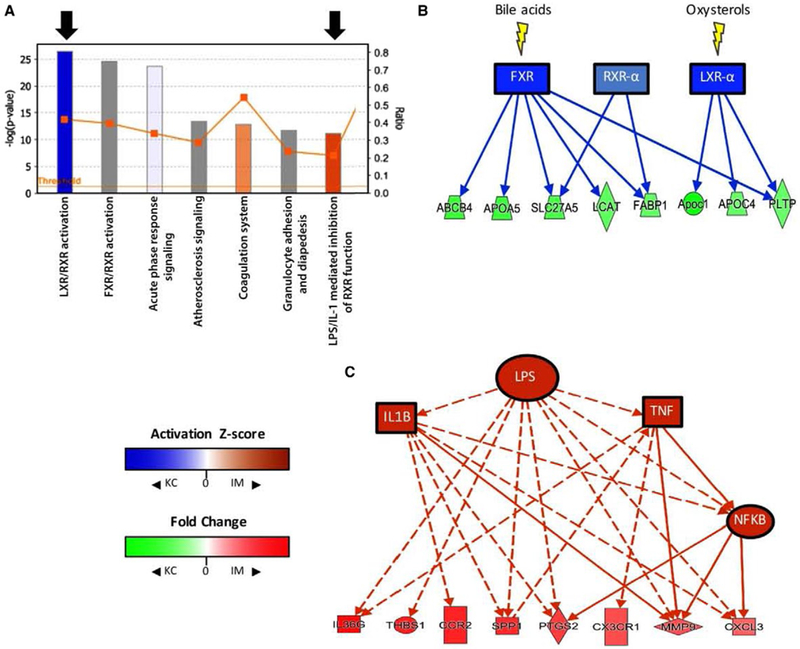
Upstream analysis of diseased KCs and IMs suggests differences in activity of regulators of inflammation. (A) A bar and line graph generated by IPA depicts the top canonical pathways that were activated in KCs (blue) or IMs (orange). Bars represent significance (−log [P value], left y-axis), and the line graph represents the fraction of known genes in a given pathway that are differentially expressed in the data set (right y-axis). The top seven most significant pathways are shown (descending order left to right). Black arrows identify two notable activated pathways in KCs and IMs. (B) A pathway diagram (IPA) showing predicted activation of bile acid and oxysterol receptors (blue nodes; z score ≤−2) in diseased KCs compared to IMs. Green nodes are genes that are enriched in KCs and known to be controlled by these receptors. (C) A pathway diagram (IPA) showing proinflammatory upstream regulators (orange nodes) that are predicted to be active (z score ≥2) in IMs and may be responsible for expression of a number of IM-enriched genes (red nodes) (solid line = direct interaction; dashed line = indirect interaction; orange line = leads to activation; blue line = leads to inhibition). Abbreviations: ABCB4, adenosine triphosphate binding cassette subfamily B member 4; APOA5, apolipoprotein A5; CXCL3, C-X-C motif chemokine ligand 3; CX3CR1, C-X3-C motif chemokine receptor 1; FABP1, fatty acid binding protein 1; FXR, farnesoid X receptor; IL36G, IL-36 gamma; LCAT, lecithin-cholesterol acyltransferase; NFκB, nuclear factor kappa B; PTGS2, prostaglandin-endoperoxide synthase 2; SLC27A5, solute carrier family 27 member 5; THBS1, thrombospondin 1.