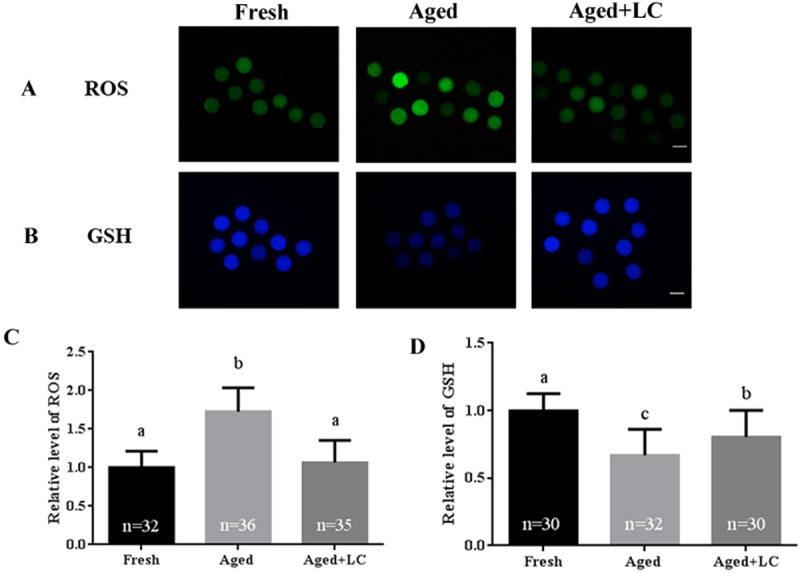
Fig. 2.

Effect of L-carnitine (LC) on ROS and GSH levels in aged bovine oocytes in vitro. (A) Oocytes were stained with H2DCFDA to detect the intracellular levels of ROS. Scale bar: 100 µm, R = 3. (B) Oocytes were stained with Tracker Blue CMF2HC dye to detect the intracellular levels of GSH. Scale bar: 100 µm, R = 3. (C) and (D) The relative intracellular levels of ROS and GSH in bovine oocytes from the three groups (fresh, aged, and aged + LC). Statistically significant differences are represented with different letters (P < 0.05).
