Figure 6.
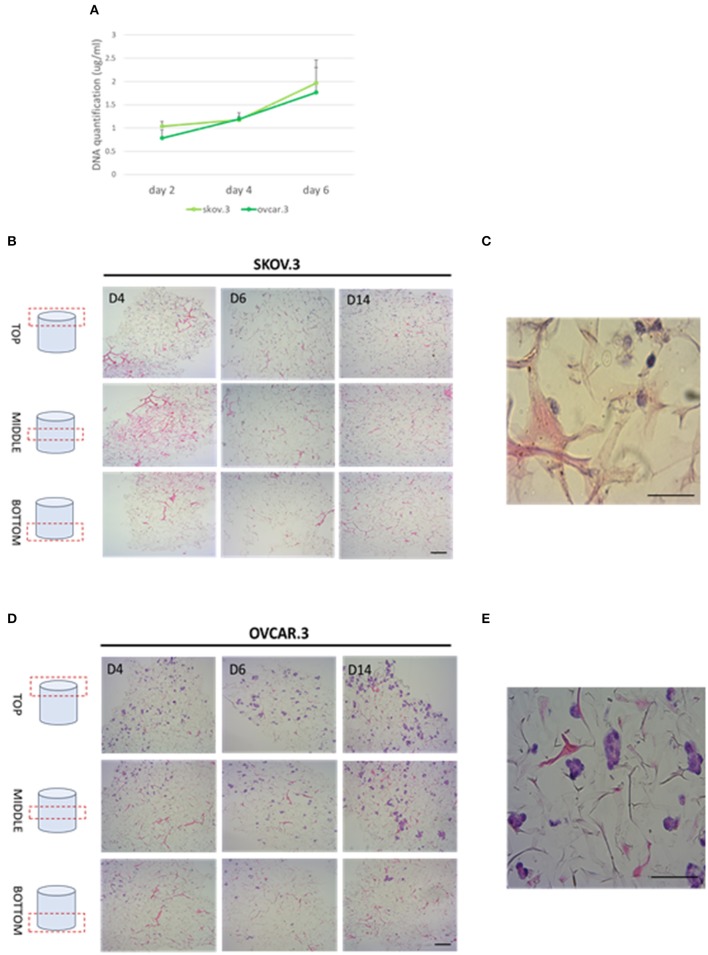
Cell proliferation and migration through a 3D-jellyfish collagen scaffold. (A) SKOV.3 and OVCAR.3 cells proliferation rate on 3D jellyfish scaffold from day 2 to 6 assessed through DNA quantification using PicoGreen® dsDNA quantitation assay. (B) SKOV.3 cells were seeded on the top of the scaffold and they migrated and colonized the entire scaffold to the bottom from day 4 to 14. (C) High magnification of SKOV.3 cells directly interacting with collagen as single cells. (D) OVCAR.3 cells were seeded on the top of the scaffold and they migrated and colonized the entire scaffold to the bottom from day 4 to 14. (E) High magnification of OVCAR.3 cells directly interacting with collagen as cluster of cells. Scale bars indicate 100 um.

