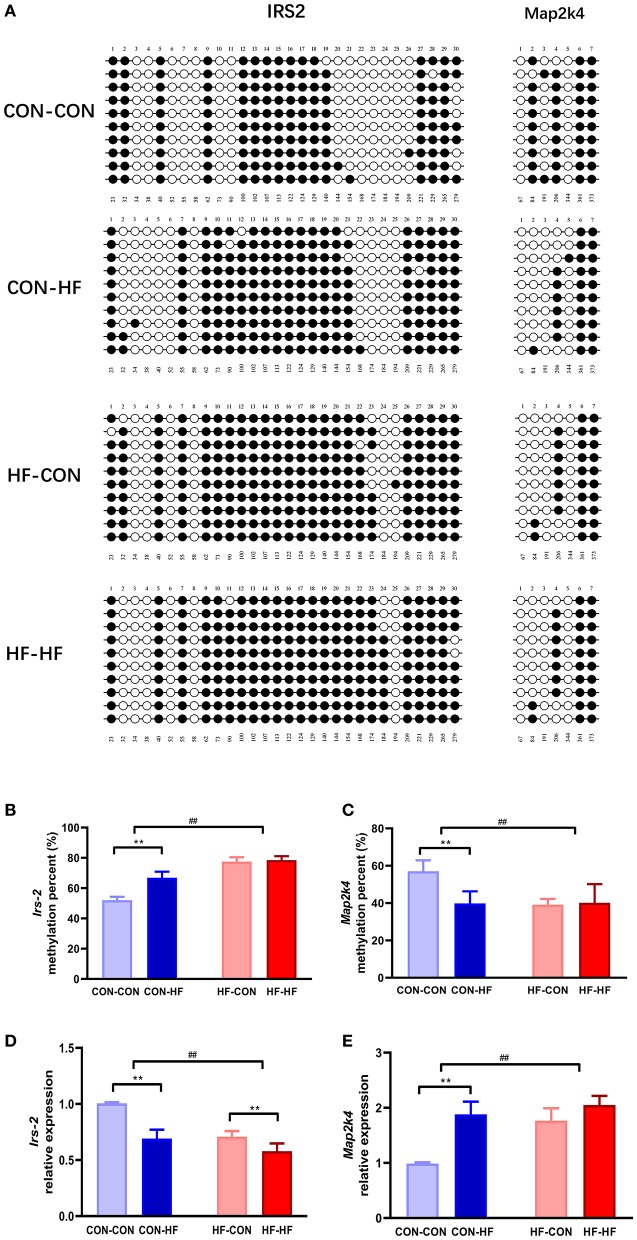
Figure 6.
Validation of methylation array using bisulphite sequencing. (A) Schematic diagram of bisulphite sequencing results on 30 CpG sites on Irs2 and 7 CpG on Map2k4. Open circles indicate unmethylated CpGs, and closed circles indicate methylated CpGs. Methylation ratio of Irs2 (B) and Map2k4 (C) in different groups. Relative gene expression of Irs2 (D) and Map2k4 (E) in different groups. **P < 0.01 offspring diet effect; ##P < 0.01 maternal diet effect. Values are mean ± SEM (n = 10). CON-CON, control diet mother-postweaning control diet; CON-HF, control diet mother-postweaning high-fat diet; HF-CON, high-fat diet mother-postweaning control diet; HF-HF, high-fat diet mother-postweaning high-fat diet.

