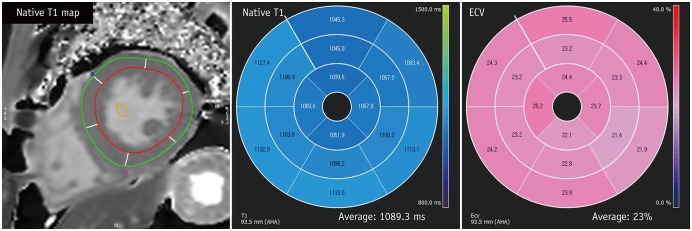
Fig. 14. T1 mapping images of 43-year-old male with Fabry disease.
After drawing endocardial contour and epicardial contour in native T1- and post T1 mapping images, T1 value and ECV are calculated. Fabry disease has special characteristics of low T1 value and normal ECV. This patient also had low T1 value of 1089.3 ms and normal ECV value of 23%.

