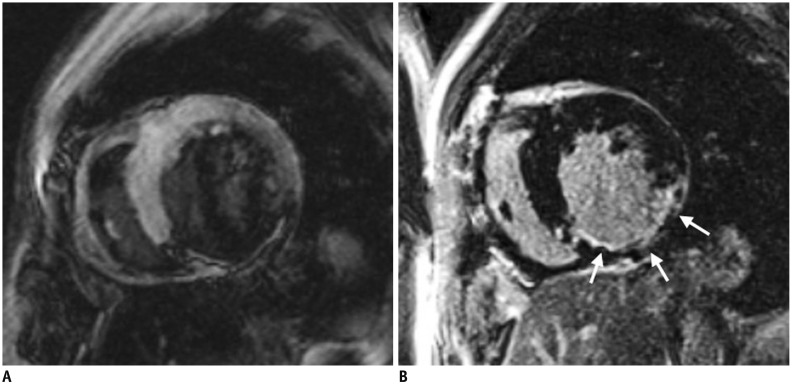
Fig. 8. Role of TI in LGE imaging.
Left image (A) shows wrong nulling of normal myocardium that is shown to be darkest at border with higher SI centrally. These findings signify that degree of LGE may be underestimated if TI is too short. Right image (B) shows optimal nulling of myocardium with repeated image taken at longer TI and demonstrates larger LGE area in inferior wall (arrows). TI = inversion time

