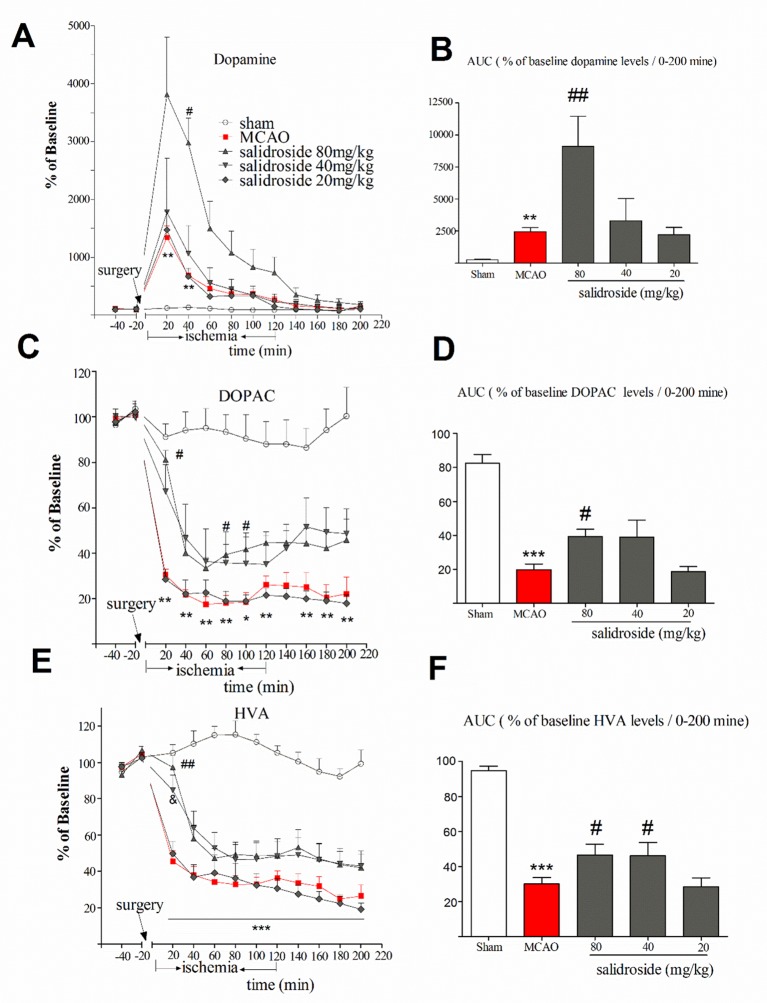
Figure 3.
Time-course percentage changes in extracellular DA, DOPAC, and HVA levels in the striatum during cerebral ischemia/reperfusion under a single i.p. injection of saline solution or salidroside (80 mg/kg, 40 mg/kg, and 20 mg/kg). Extracellular levers of DA, DOPAC, and HVA in the striatum were monitored for 4 h; their levels are expressed as percentage of baseline (A, C, E). The area under curve (AUC) for extracellular percentage of baseline DA, DOPAC, and HVA levels was calculated from their release curves and was plotted in the striatum over a period of 200 min (0-200 min) (B, D, F). The arrow indicates the surgery of MCAO. Each column represents the mean and the SEM, n = 7. **p < 0.01, ***p < 0.01 compared to the sham group; # p < 0.05, ## p < 0.01, & p = 0.058 compared to the MCAO group. AUC area under the curve, DA dopamine, DOPAC 3,4-dihydroxyphenylacetic acid, HVA homovanillic acid, MCAO middle cerebral artery occlusion, SEM standard error of the mean.

