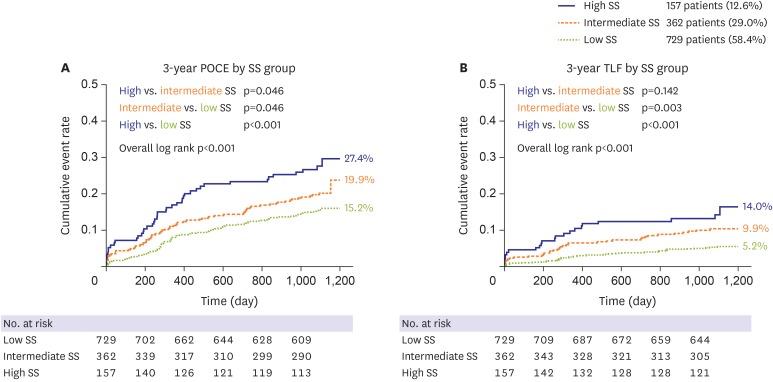
Figure 1. Kaplan-Meier curve according to SS, for (A) 3-year POCE, and (B) 3-year TLF. 3-year POCE and 3-year TLF increased along with SS, in the low-, intermediate-, and high SS group (low SS, SS<23; intermediate SS, 23≤SS≤32); high SS, SS>32).
POCE = patient-oriented composite endpoint; SS = SYNergy between percutaneous coronary intervention with TAXus and cardiac surgery score; TLF = target lesion failure.

