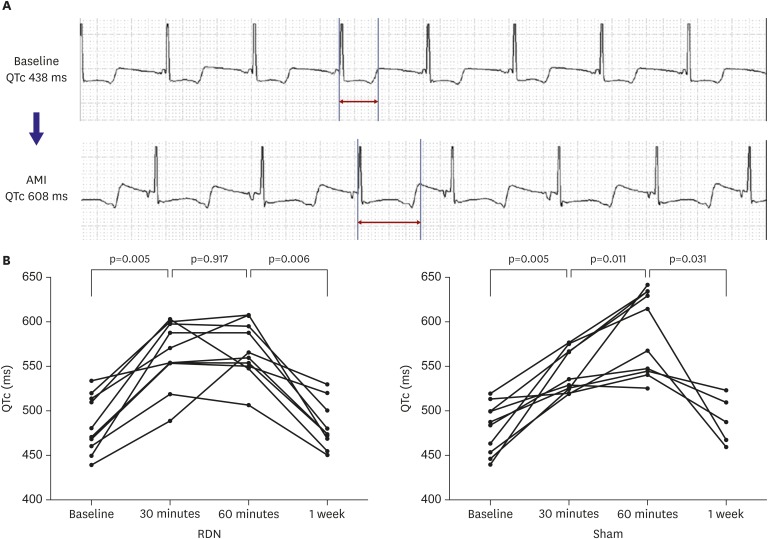
Figure 4. (A) A representative electrogram complex from a heart undergoing occlusion of the middle left anterior descending artery is shown. The QTc interval was prolonged from 438 ms to 608 ms. (B) Line graph displaying the average QTc interval at baseline, after AMI induction, after the renal denervation procedure, and 1 week later. After AMI, QTc interval was prolonged in both groups and were significantly greater in the Sham group. QTc interval returned to normal in all pigs after 1 weeks.
AMI = acute myocardial infarction; QTc = corrected QT.

