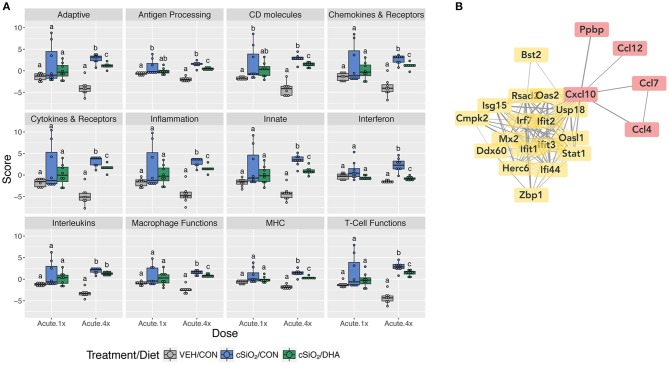
Figure 3.
Pathway Z scores and network visualization for acute transcriptional response of immune-associated genes in DHA-supplemented mice that received either a single or four weekly instillations of cSiO2. (A) For cSiO2-exposed mice, gene expression pathway scores were calculated as the first principal component of the pathway genes' normalized expression and standardized by Z scaling. Immune pathway Z scores are presented as Tukey box-plots (n = 8) for select immune pathways of interest. Different letters indicate treatment/diet groups are significantly different (p < 0.05) as determined by the Steel-Dwass nonparametric test for all pairs. Heatmaps depicting individual pathway Z scores for all pathways captured by the NanoString PanCancer Immune Profiling gene panel are provided in Supplementary Figure 7. (B) Network interactions were modeled using the STRING database (string-db.org) with a minimum required interaction score ≥0.7, and clusters were identified using the Markov Cluster (MCL) algorithm with inflation parameter of 1.5. The network was visualized in Cytoscape, and edge widths reflect the combined interaction score (thicker edges indicate higher score). Note, a network for mice treated only once with cSiO2 (Acute.x1) was not made, as only one gene was significantly affected by DHA supplementation.

