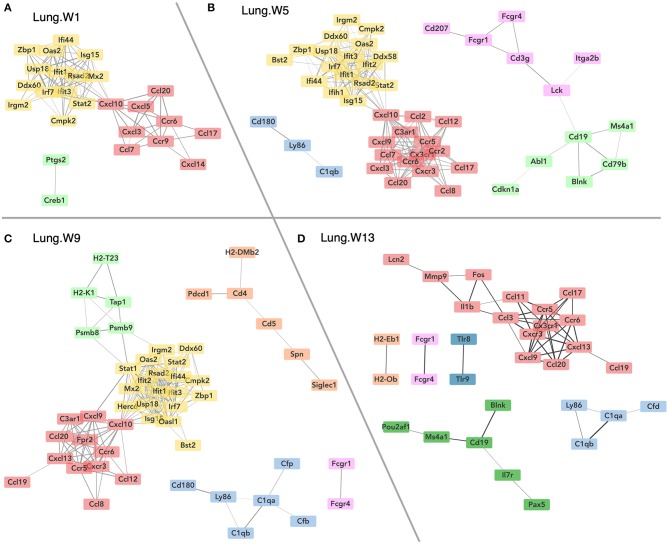
Figure 7.
Network visualization of genes significantly affected by DHA supplementation in lung tissues obtained 1 (A), 5 (B), 9 (C), or 13 (D) weeks post instillation with cSiO2. Network interactions for genes differentially regulated by either DHA low or DHA high supplementation at each time point were modeled using the STRING database (string-db.org) with a minimum required interaction score ≥0.7, and clusters were identified using the Markov Cluster (MCL) algorithm with inflation parameter of 1.5. The network was visualized in Cytoscape, and edge widths reflect the combined interaction score (thicker edges indicate higher score).

