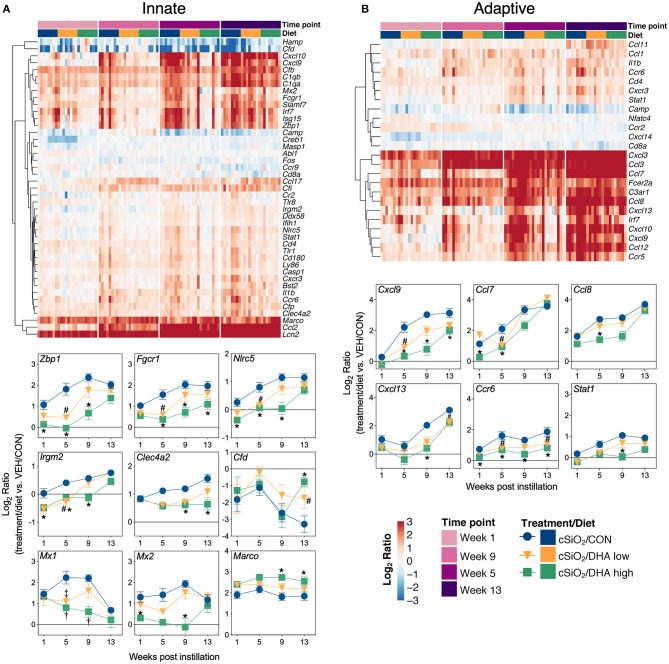
Figure 8.
Time course of DHA-responsive genes associated with innate and adaptive immune pathways in lung tissues of mice 1, 5, 9, or 13 weeks post instillation with cSiO2. Gene expression data were obtained using the NanoString PanCancer Immune Profiling gene panel and are shown as log2 ratios for cSiO2-exposed mice fed CON, DHA low, or DHA high diets calculated with respect to time-matched, vehicle-exposed, CON-fed controls (VEH/CON; log2 ratio = 0). For innate (A) or adaptive (B) immune pathways, heatmaps with unsupervised clustering (Euclidian distance method) by gene depict log2 expression values for all genes identified as significantly differentially expressed (FDR q < 0.05, 1.5-fold change) at any one of the indicated time points. The mean log2 ratio values ± SEM for selected genes of interest are also shown. *p < 0.05 for DHA high compared to CON diet and #p < 0.05 for DHA low compared to CON diet as determined by nSolver statistical analyses (see Supplementary File 2 for test specifications and FDR-corrected q-values). †p < 0.05 for DHA high compared to CON diet and ‡p < 0.05 for DHA low compared to CON diet as determined by non-parametric Kruskal–Wallis test (for Mx1 only).

