Figure 1.
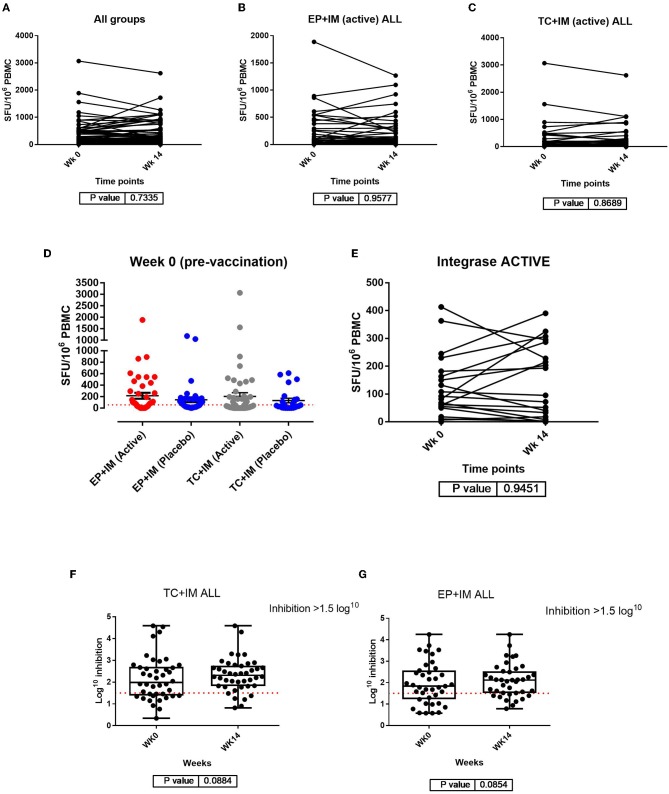
Analysis of IFN-γ responses by ELISpot: (A) Comparison of IFN-ɤ ELISpot responses pre vaccination and at the primary endpoint for all participants (both groups); (B) Comparison of IFN-ɤ response from week 0 to week 14 with all peptide pools together for the EP+IM group (active); (C) Comparison of IFN-ɤ response from week 0 to week 14 with all peptide pools together for the TC+IM group (active) to all peptide pools. Statistical significance is set at p = <0.05 (Wilcoxon matched-pairs signed t test). Each dot joined together by a line is an individual's IFN-ɤ response at week 0 and 14. (D) Scatter dot plot showing baseline IFN-ɤ response at week 0 (pre vaccination) by group. All units are in SFU/M PBMC with background (from negative/mock wells) subtracted. The red dotted line represents the cut off of >55 SFU/M but participants also had to meet the second criteria to be a positive responder (>4 x baseline response if baseline response is more than 0). Viral inhibition assay: (E) IFN-ɤ ELISpot responses to Integrase peptide for both groups receiving active drug at week 0 and week 14. (F) Comparison of viral inhibition (log10) between week 0 and week 14 in the TC+IM group (including placebo). (G) Comparison of viral inhibition between week 0 and week 14 in the EP+IM group (including placebo). The red line represents the cut off for positive inhibition of >1.5 log10. Statistical significance set at p = < 0.05.

