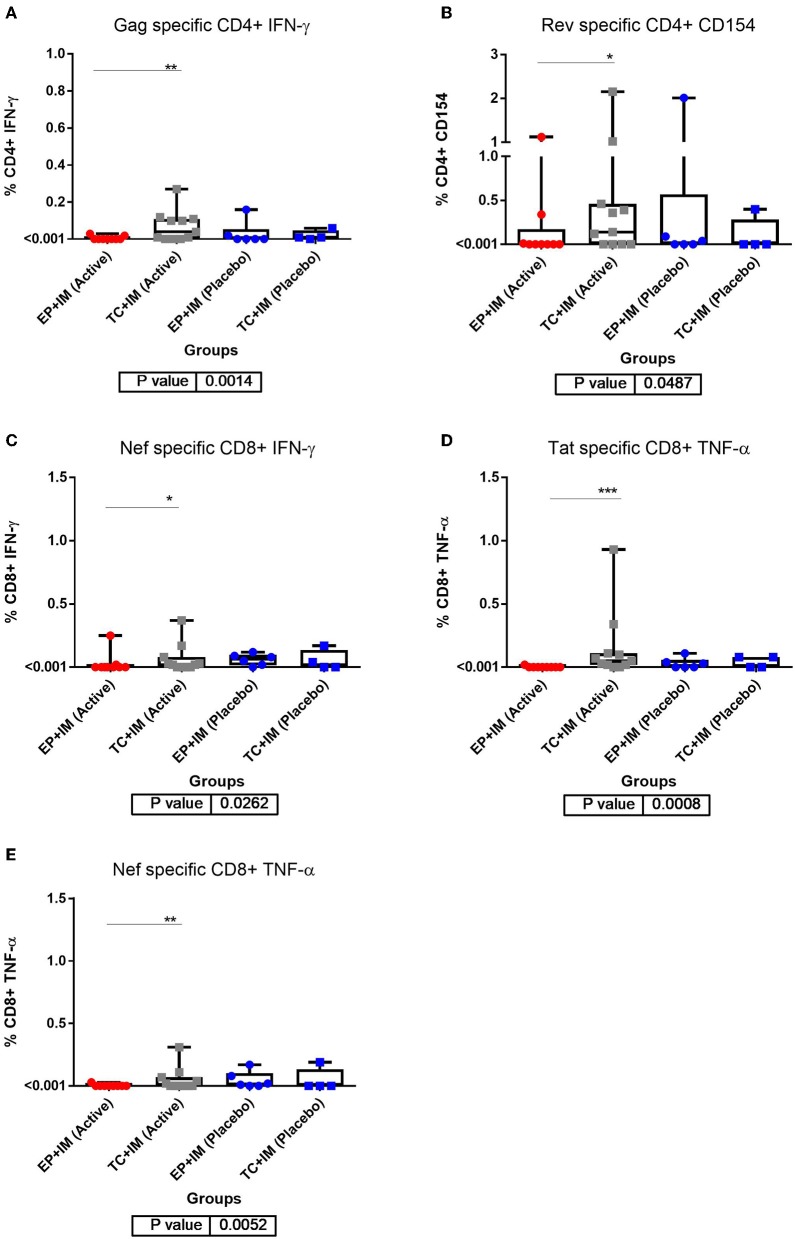
Figure 2.
ICS analysis of T cell responses to DNA vaccination: (A) CD4+ IFN-ɤ response at primary endpoint (week 14) for all groups to Gag; (B) CD4+ CD154 response at primary endpoint (week 14) for all groups to Rev; (C) CD8+ IFN-ɤ response at primary endpoint (week 14) for all groups to Nef; (D) CD8+ TNF-α response at primary endpoint (week 14) for all groups to Tat; and (E) CD8+ TNF-α response at primary endpoint (week 14) for all groups to Nef. Statistical significance for all result is set at p = <0.05. *p < 0.05, **p <0.01, ***p<0.001.

