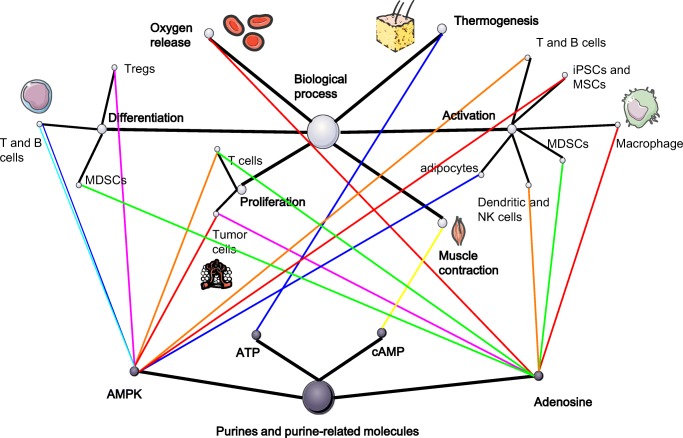
Fig. 3.
A summary of the regulatory network of purines, metabolic reprogramming, and biological process: the dark spots above represent the purines and the light spots represent the various biological process. Finally, the lines linking these two balls represent the metabolic pathways that are regulated by purines and result in the functional alteration. The types of metabolic pathways are represented by the colors of lines, which are illustrated in the lower right corner

