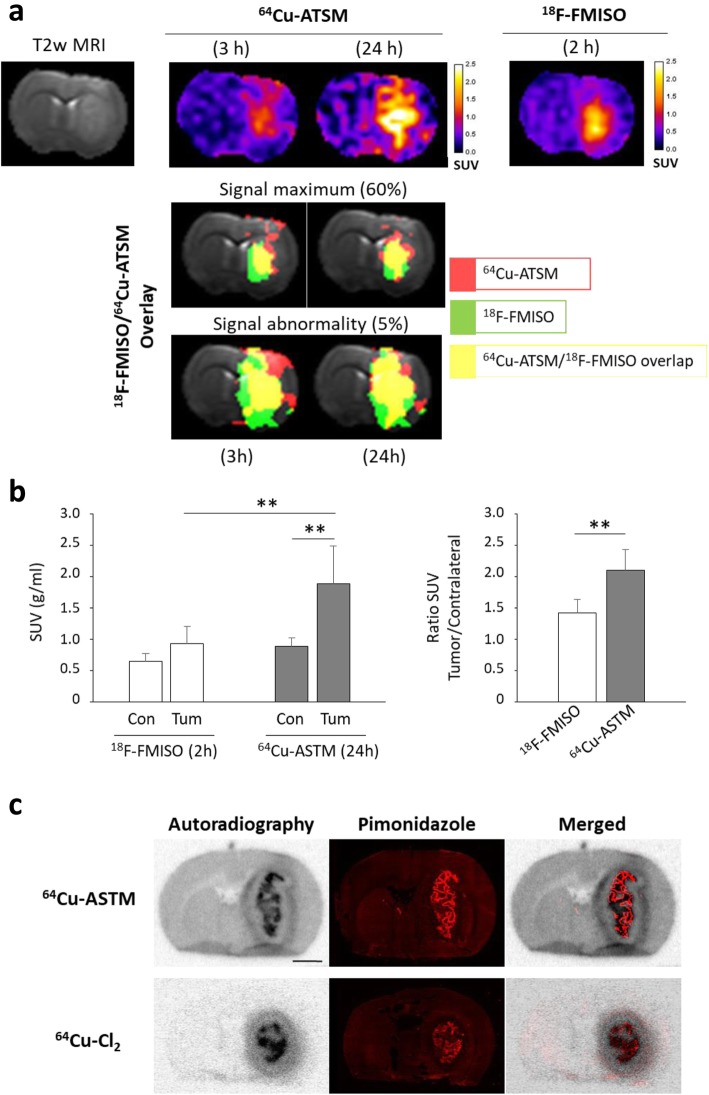
Fig. 3.
Relationships between retention of 64Cu-ATSM and 64Cu-Cl2 and hypoxia. a Co-registration of 18F-FMISO PET signal (2 h post-injection) with 64Cu-ATSM PET signal (3 h or 24 h post-injection). The overlaid images corresponds to 60% signal maximum or 5% signal abnormality for 64Cu-ATSM (red), 18F-FMISO (green), or 64Cu-ATSM/18F-FMISO merged (yellow). b 18F-FMISO and 64Cu-ATSM uptake were evaluated at 2 h and 24 h after radiotracer injection, respectively. Quantification of 64Cu-ATSM and 18F-FMISO uptake from ipsilateral (tumor) and contralateral (healthy brain) SUVs (left part) or ratio between tumor and contralateral SUVs (right part) at the different imaging points. Mean ± SD, n = 5 rats for 18F-FMISO and n = 3 rats for 64Cu-ATSM. Tukey’s HSD test after significant two-ways ANOVA (radiotracer and ROI factors): **p < 0.01. c From same coronal rat brain sections performed 24 h after 64Cu-ATSM or 64Cu-Cl2 injection, autoradiography and pimonidazole immunostaining were done to evaluate overlapping of these two labeling. Scale bar = 250 μm

