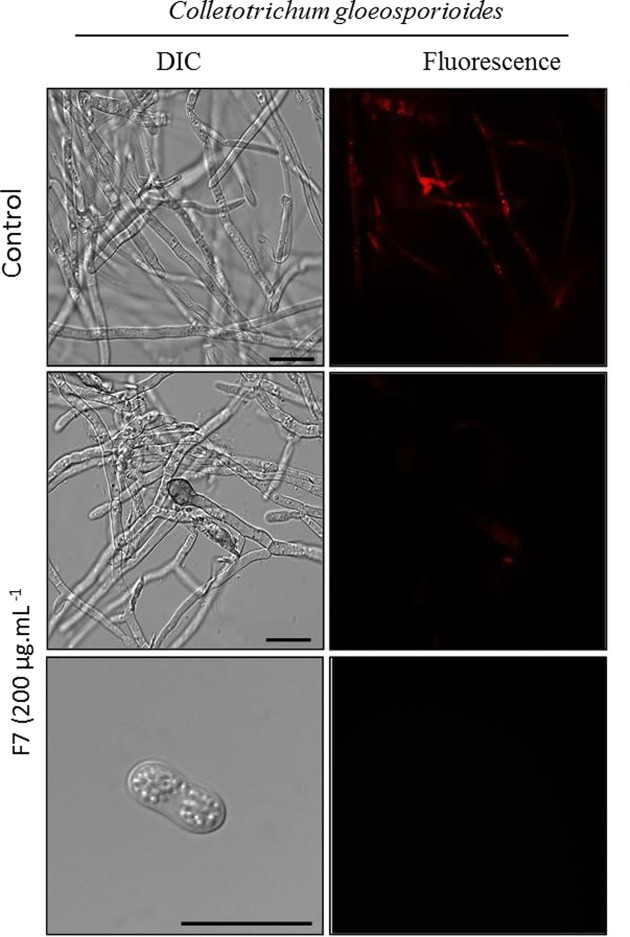
Figure 7. Mitochondrial functionality assay.
Cells and spore of C. gloeosporioides after mitochondrial functionality assay, visualized by fluorescence microscopy using Rhodamine 123 fluorescent probe. Cells were treated with 200 μg ml−1 of IIFF7Ca peptide for 24 h and then analyzed for mitochondrial functionality. Control cells were treated only with the Rhodamine 123 probe; bars = 20 μm.

