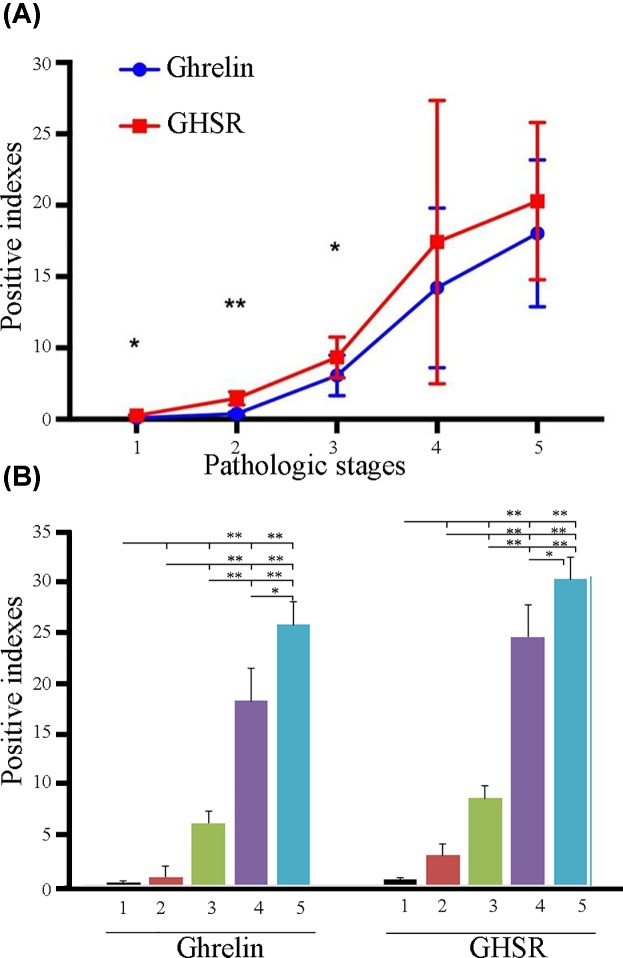
Figure 4. Comprehensive analysis of ghrelin and GHSR.
Comprehensive analysis of positive index between ghrelin and GHSR group (t test) (A); comparison of positive indices of ghrelin and GHSR in different pathologic stages (one-way ANOVA) (B). In the Figures, 1–5 indicated normal, mild dysplasia, moderate dysplasia, severe dysplasia, and OSCC, respectively. * indicated P < 0.05, ** indicated P < 0.01

