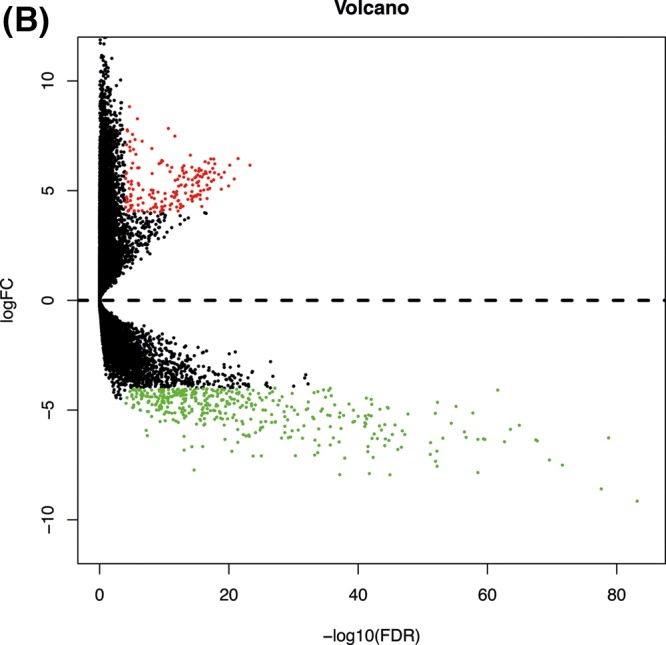
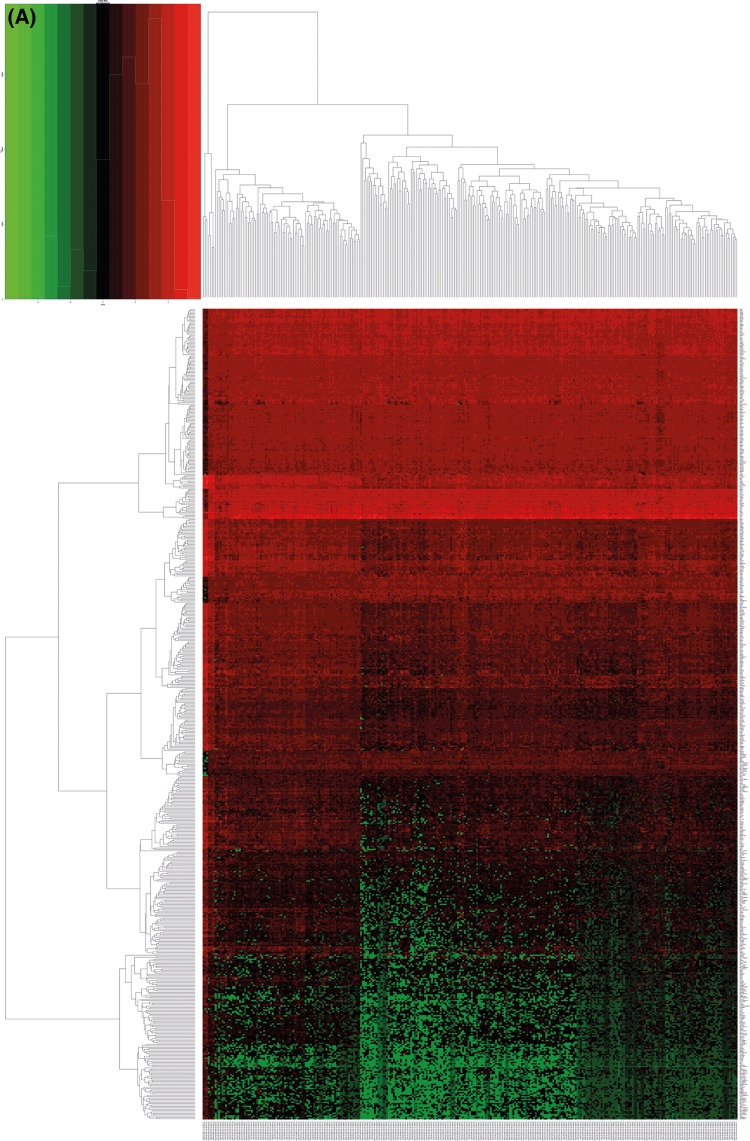
Figure 1. Differential expression genetic map of CC in the TCGA database.

(A) It is a heatmap. Red represents high expression, and green represents a low expression. (B) It is a volcano plot. The x-axis is the logarithm of −log10 after correction. The larger the value, the more significant the difference. The y-axis is log2 (FC), and the larger the absolute value, the greater the fold change.

