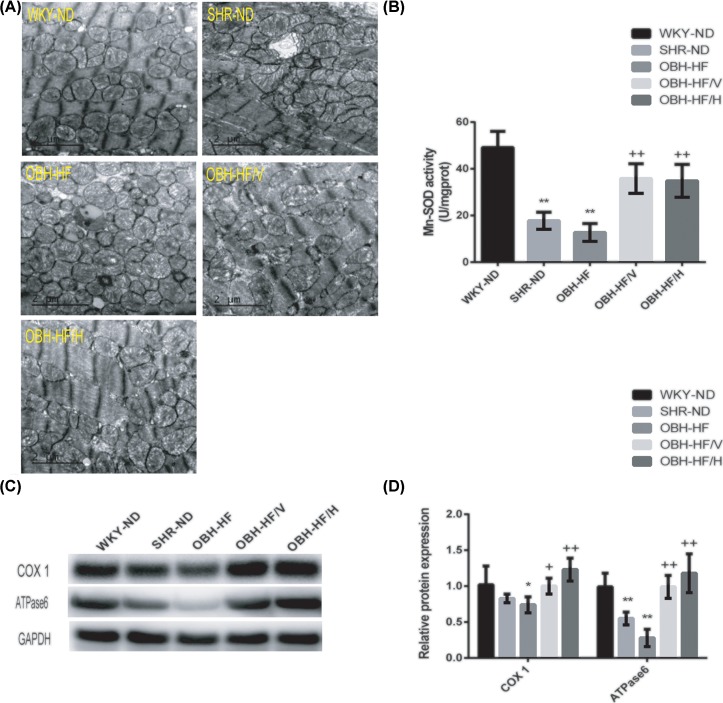
Figure 3. HQQR improved the morphology of mitochondria and inhibited oxidative stress damage.
(A) Representative photomicrographs of transmission electron microscope; 8200× magnification. (B) The level of the Mn-SOD activity was assayed in each group (n = 4 per group). (C) The protein expression of COX1 and ATPase6 was determined by immunoblotting. (D) Western blot quantification of COX1 and ATPase6 levels (n = 4 per group). Data are mean ± SD. *P < 0.05, **P < 0.01 compared with WKY-ND; +P < 0.05, ++P < 0.01 compared with OBH-HF.

