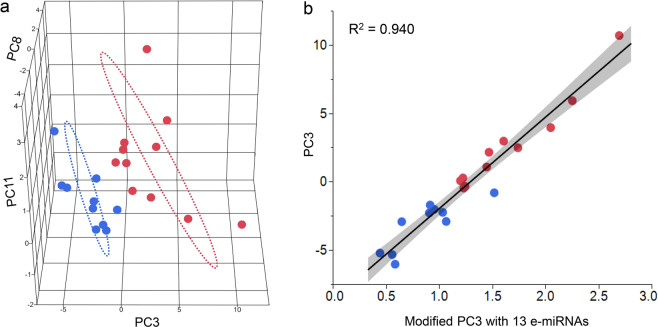
Figure 1.
Principal component analysis (PCA) of the e-miRNA expression profiles in severe ICAD patients and correlation analysis between PC3 and 13 e-miRNAs. 3D Scatterplot of PCA of the e-miRNA expression profiles in severe ICAD patients (panel a). The principal component 3 (PC3) was statistically significantly associated to the outcome of response to medical management (p = 0.0052). When PC3 is used on the horizontal X axis, there is an evident differentiation in the distribution of the e-miRNA expression between ICAD patients with recurrent ischemic events despite IMM (blue dots) and those responding to medical management (red dots). Panel b shows the correlation analysis between PC3 and the modified PC3 computed by using only the 13 e-miRNAs with the highest absolute coefficients (>75% quantile). There is a preserved high correlation between the original PC3 and the modified PC3 (R2 = 0.94) and the modified PC3 is able to differentiate non-responders to IMM (blue dots) from responders (red dots).

