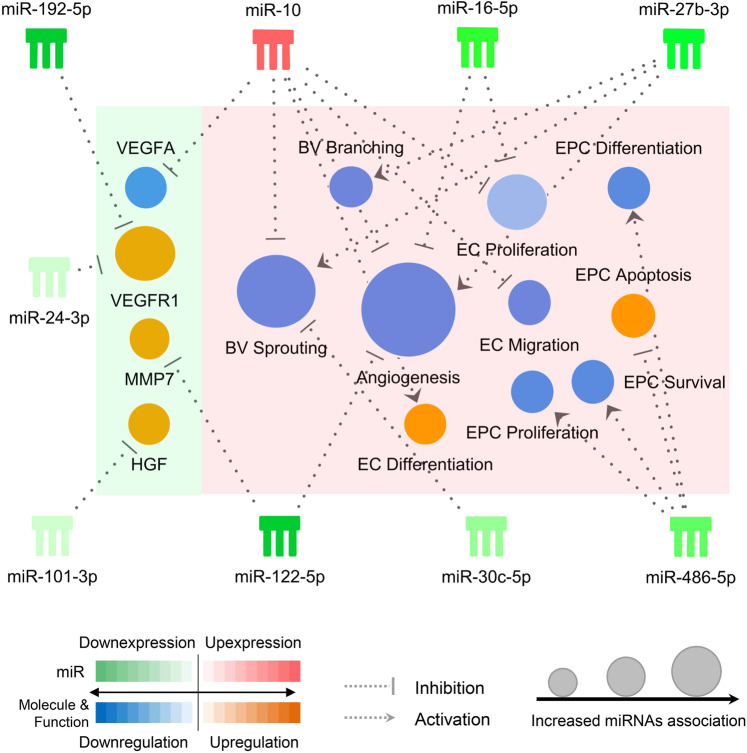
Figure 3.
Schematic illustration of a causal network in the Ingenuity Pathway Analysis (IPA) environment. The figure shows the dominant e-miRNAs (comb-shaped symbols), their significantly associated angiogenesis functions (circles in the pink shade) and angiogenic factors (circles in the cyan shade). The angiogenic factors selected (VEGFA, VEGFR1, MMP7, and HGF) were associated to recurrent ischemic events in ICAD in previously published studies (Reference #21 and #22). The e-miRNAs and their target molecules and functions are connected through dotted lines ended with either an arrow or a perpendicular solid line, indicating activated or inhibitory effect, respectively. A biological function or molecule with a stronger association to e-miRNAs has a larger circular size. The relative expression levels of the e-miRNAs in non-responders were scaled by a diverging palette from dark green (downexpression) to dark red (upexpression), while the regulatory effect on the biological functions and molecules were scaled by the other diverging palette from dark blue (downregulation) to dark orange (upregulation). The specific e-miRNA expression profiles in non-responders is predicted by the molecular activity predictor (MAP) to inhibit all the proangiogenesis-related biological functions with the exception of differentiation of endothelial cells, resulting in a net inhibition of angiogenesis. The expression change of the molecules in accordance to the e-miRNA expression profile in non-responders is consistent with the actual findings in the previous studies. VEGFA, vascular endothelial growth factor A; VEGFR1, vascular endothelial growth factor receptor 1; MMP7, matrix metalloproteinase 7; HGF, hepatocyte growth factor; BV, blood vessel; EC, endothelial cell; EPC, endothelial progenitor cell; miR, microRNA

