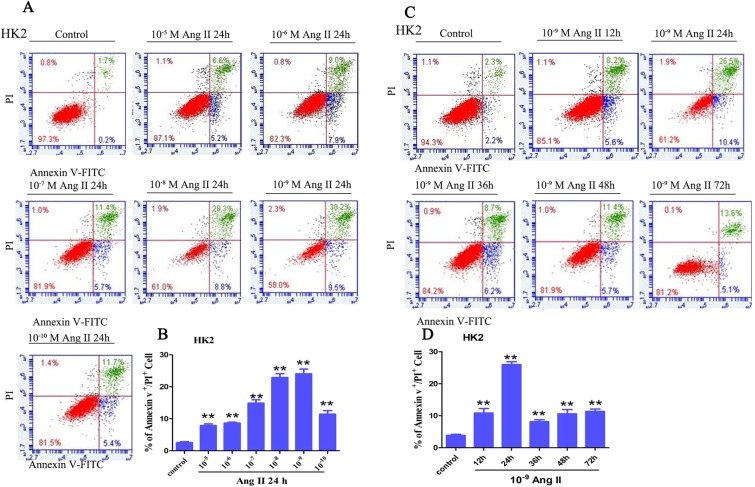
Figure 4.
Detection of necrotic tubular epithelial cells using a flow cytometer. (A,B) HK-2 cells were treated with varying concentrations of Ang II (10−10–10−5 M) for 24 h. (C,D) HK-2 cells were exposed to 10−9 M Ang II for different times. After treatment, HK-2 (upper panel) cells were stained with annexin V-FITC and PI to determine cell necrosis (annexin V+/PI+ cells) using a flow cytometry assay. The bar chart shows that the ratio of annexin V+/PI+ cell numbers was highest in the HK-2 cells treated with 10−9 M Ang II for 24 h.

